BCI Mental Workload
Monitoring mental workload during sensorimotor rhythm BCI training using functional near-infrared spectroscopy over the prefrontal cortex
Bachelor’s Thesis, Biomedical Engineering School, International University, Vietnam National University HCMC, 2019.
Introduction
Sensorimotor rhythm (SMR)-based brain-computer interfaces (BCIs) give paralyzed users direct control of external devices by translating imagined hand movements into machine commands (Han & Bin, 2014). The technology is scientifically mature enough to navigate wheelchairs, move robotic arms, and restore cursor control (Leeb et al., 2013). Yet it comes with a significant practical burden: users must undergo weeks or months of intensive training to learn to modulate their own EEG signals reliably, and a meaningful fraction of participants drop out because they cannot gain control at all (Myrden & Chau, 2015).
A central but underappreciated problem in this training is mental workload. Several reviews have noted that sustaining and manipulating motor imagery can be extremely demanding, especially for disabled users (Han & Bin, 2014). Yet most attempts to quantify this burden have relied on post-hoc subjective surveys (Felton et al., 2012), which are coarse, retrospective, and unsuitable for real-time adaptive systems. Ideally, a training environment would monitor the user’s cognitive state continuously and adapt task difficulty to keep the user in an optimal engagement zone, neither bored at levels below their skill nor overwhelmed above it, following the Yerkes-Dodson curve.
Achieving that requires an objective, real-time measure of mental workload that does not interfere with the EEG control signal. As discussed in the [Primer] BCI Using EEG companion post, the EEG features used for motor imagery classification (mu and beta band power modulations, ERD/ERS) overlap substantially with the EEG features used for workload assessment (alpha and theta power changes), making it impractical to use EEG for both purposes simultaneously on the same recording.
This project investigates whether functional near-infrared spectroscopy (fNIRS) over the prefrontal cortex (PFC) can serve as that workload monitor (Girouard et al., 2009; Sassaroli et al., 2008; Solovey et al., 2011). Because fNIRS measures hemodynamic changes via optical absorption, it is spectrally and spatially orthogonal to the EEG motor signals, making it a natural complementary modality (Villringer & Chance, 1997). For the underlying biophysics and signal processing of fNIRS, see the [Primer] fNIRS for Brain Sensing companion post.
To my knowledge, this is the first study to evaluate fNIRS for mental workload monitoring specifically during SMR-based BCI training.
Methods
Participants
Study 1 (calibration stage): three healthy male volunteers, age 20, all naive to BCI.
Study 2 (adaptive feedback stage): five volunteers (one female, mean age 20.4, SD 1.3 years). One participant was excluded due to excessive fNIRS noise from an unusual forehead geometry that allowed optical leakage. The remaining four were divided by BCI expertise: three naive participants with no prior BCI experience, and one expert participant who had undergone months of prior BCI training and could control external devices by thought alone.
All participants were right-handed (Edinburgh Handedness Inventory) with no reported neurological, cardiovascular, or visual abnormalities. Written informed consent was obtained and the Declaration of Helsinki was followed.
Dual EEG and fNIRS Recording
EEG and fNIRS were recorded simultaneously throughout all sessions.
EEG was acquired with a Biosemi ActiveTwo system. Seventeen electrodes (FCz, FC1-4, Cz, C1-6, CPz, CP1-5) were placed over the primary motor cortex following the 10-20 international system.
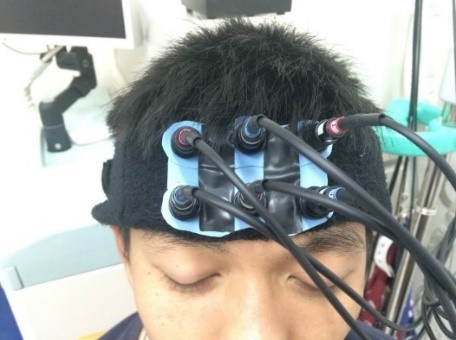
fNIRS was recorded with a SHIMADZU FOIRE-3000 system at three wavelengths (780, 805, and 830 nm). A 2×3 optode array with 3-cm source-detector separation was mounted over the PFC, yielding 7 channels sampled at 18 Hz. The array was positioned so that the bottom of the headgear touched the tops of the subject’s eyebrows, with the central probes aligned to the midline.
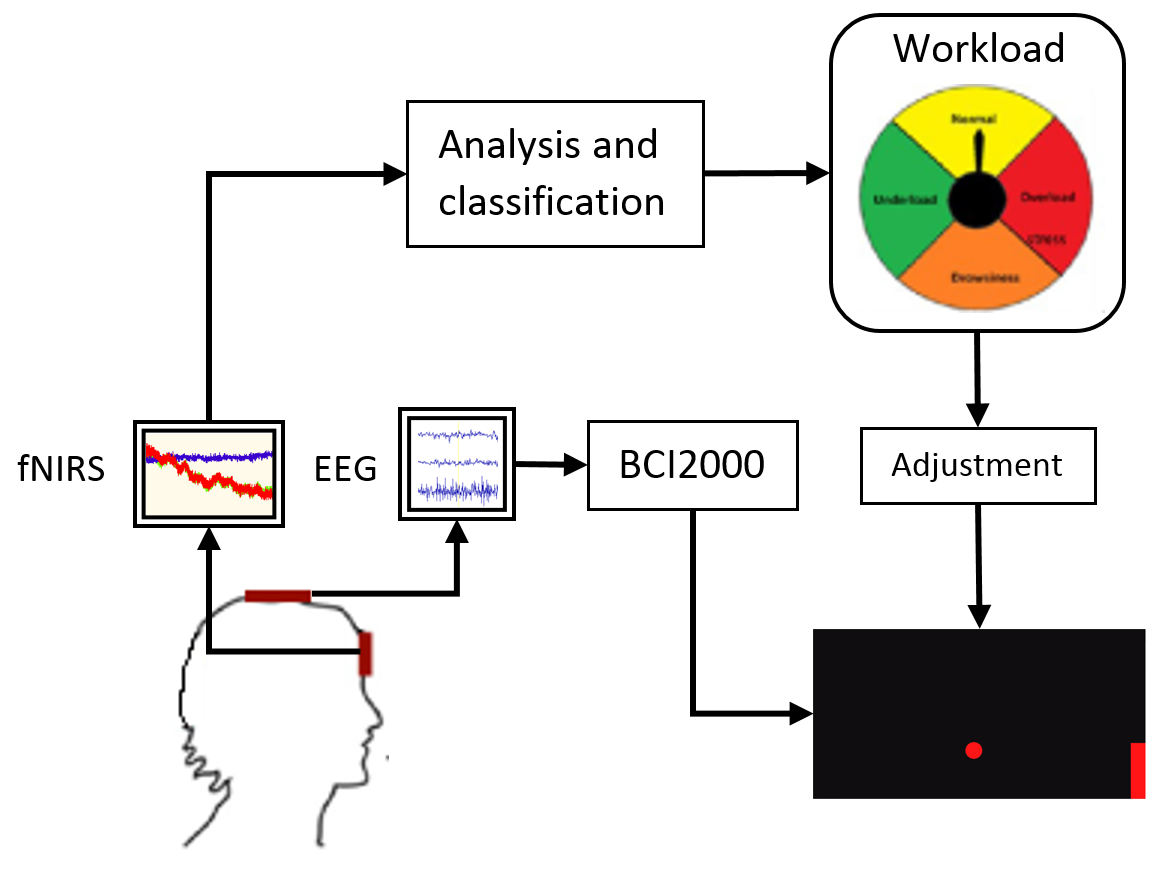

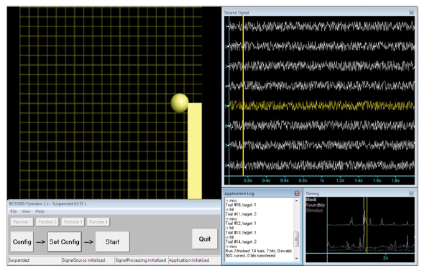
BCI Software: BCI2000
BCI training sessions were driven by BCI2000 (Schalk et al., 2004), an open-source general-purpose BCI platform. BCI2000 acquired the EEG stream in real time, performed online spectral analysis, and rendered the visual feedback interface. After the calibration stage, the frequency bands and electrodes that best separated the two motor tasks were identified from spectral analysis and coefficient-of-determination (\(r^2\)) maps, and these parameters were used to set the linear classifier driving cursor movement in the feedback sessions.
Experiment Procedure
Study 1: Calibration Stage
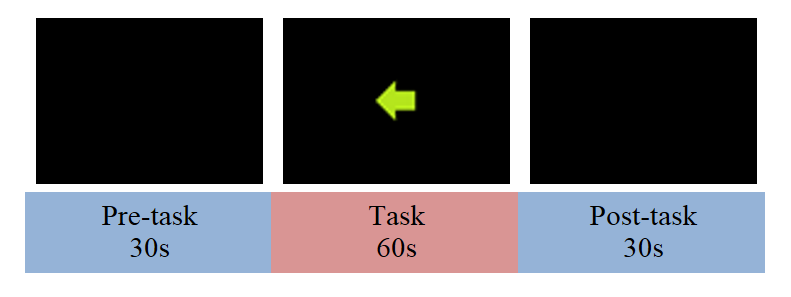
Subjects performed motor execution (actual hand gripping) and motor imagery (imagined hand gripping) in alternating runs. Each session lasted 16 minutes (8 runs of 120 seconds). Within each run, the subject rested for 30 seconds, responded to left/right movement cues over 60 seconds, then rested again. fNIRS was recorded throughout to characterize the PFC hemodynamic response to the two motor tasks before any feedback was introduced.
Study 2: Adaptive Feedback Stage
After calibration, subjects used imagined hand movement to control the vertical position of a cursor moving horizontally across the screen. A target appeared on the right side of the screen, and the subject had to guide the cursor to hit it.

Task difficulty was manipulated by the number of possible target positions per trial:
| Level | Possible targets | Approximate chance level |
|---|---|---|
| 1 | 3 | 33% |
| 2 | 5 | 20% |
| 3 | 8 | 12.5% |
More targets means a smaller vertical window per target, requiring finer cursor control and, presumably, greater cognitive effort. Each subject completed 4 sessions spaced 5-7 days apart. After each session, subjects completed the NASA Task Load Index (NASA-TLX) (Hart & Staveland, 1988) to provide subjective workload ratings.
fNIRS Signal Processing
Raw optical signals were converted to \(\Delta[\text{HbO}]\) and \(\Delta[\text{Hb}]\) using the Modified Beer-Lambert Law (Villringer & Chance, 1997; Cope, 1991) with device-specific extinction coefficients (see the fNIRS primer for the full formulation). A non-recursive bandpass filter (0.01-0.5 Hz) removed cardiac, respiratory, and motion artifacts. Each trial was baseline-corrected by zeroing its initial value.
In Study 2, only oxygenation (\(\Delta[\text{HbO}] - \Delta[\text{Hb}]\)) was used as the primary dependent variable due to the higher dimensionality of the data (multiple subjects, sessions, and difficulty levels).
Results
Study 1: Motor Execution vs. Motor Imagery
The first study tested whether fNIRS over the PFC could distinguish motor execution from motor imagery in the static calibration setting, before any performance feedback was introduced.
Oxygenation change showed no significant difference between the two tasks across all subjects and sessions. The [HbO] and [Hb] signals for both tasks remained low and closely intertwined, making the two conditions indistinguishable.
This indicates that simple motor imagery, in the absence of feedback or performance pressure, does not generate measurable differential mental workload at the PFC level. Study 2 therefore introduced the more cognitively demanding adaptive feedback condition.
Study 2: Adaptive Feedback Control
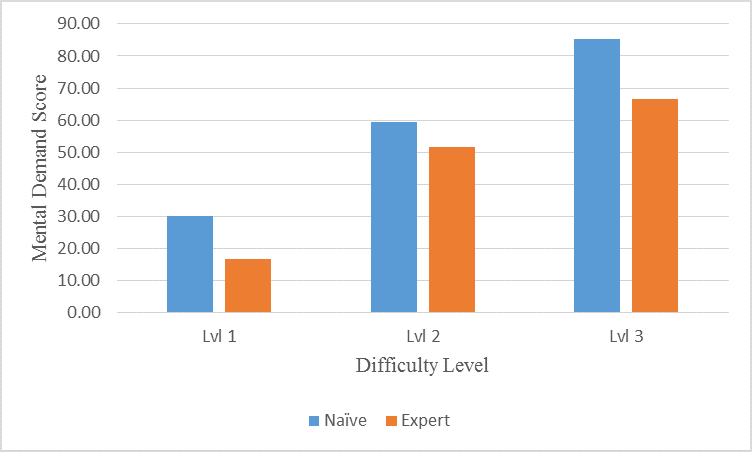
Subjective Workload (NASA-TLX)
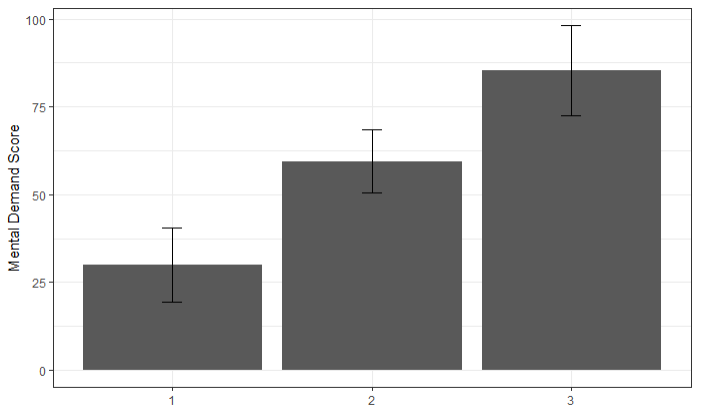
NASA-TLX Mental Demand scores confirmed that subjects experienced the three difficulty levels as distinct (F = 35.58, p < 0.001):
| Level | Mean Mental Demand | Std |
|---|---|---|
| 1 (3 targets) | 30.0 | 13.6 |
| 2 (5 targets) | 59.4 | 11.8 |
| 3 (8 targets) | 85.3 | 16.7 |
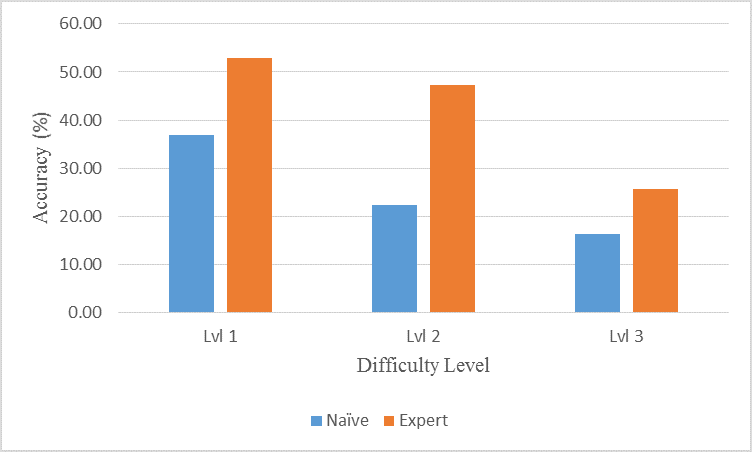
Performance
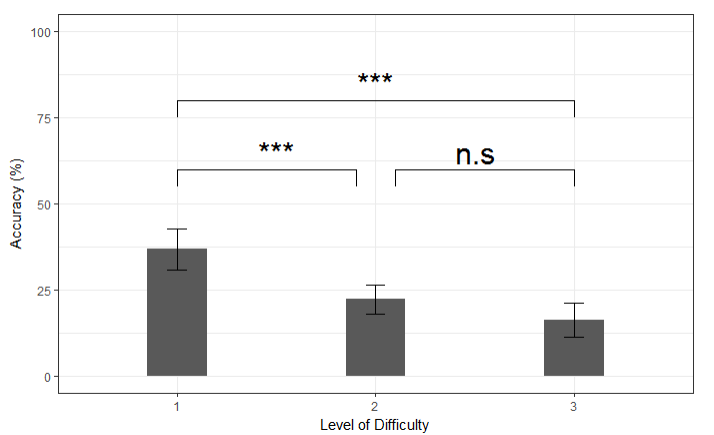
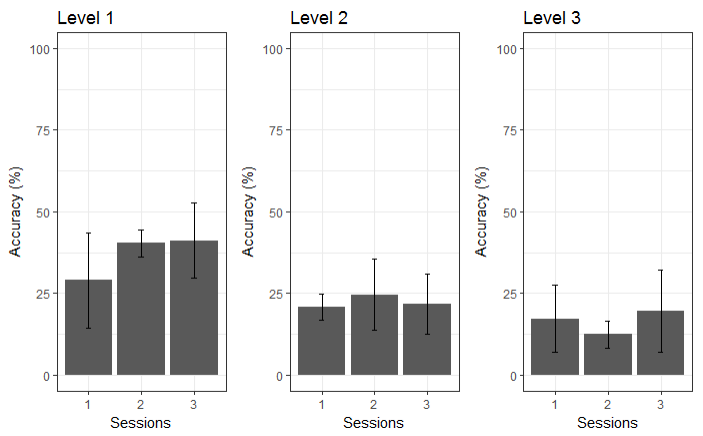
Accuracy decreased significantly as the number of possible targets increased (F = 18.378, p < 0.001). However, absolute accuracy was close to or only marginally above chance in all conditions, reflecting the early stage of training.
| Level | Absolute Accuracy (%) | Chance Level (%) | Relative Accuracy |
|---|---|---|---|
| 1 | 36.85 | 33.3 | 3.52 |
| 2 | 22.32 | 20.0 | 2.32 |
| 3 | 16.38 | 12.5 | 3.88 |
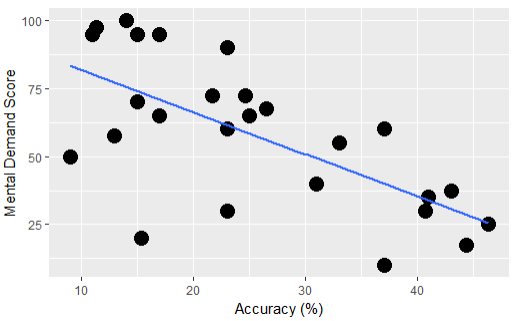
Notably, while NASA-TLX scores tracked difficulty level monotonically, they could not meaningfully discriminate actual performance. This near-chance performance across all levels is expected at the very early stage of motor imagery training, which typically requires a minimum of a dozen sessions before reliable control emerges.
fNIRS Hemodynamic Signals
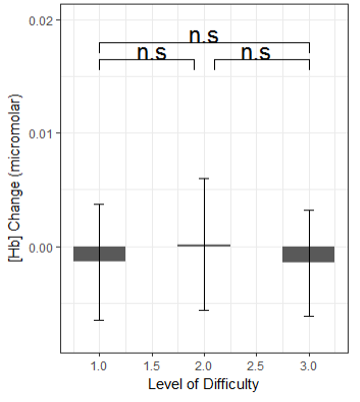
The group-averaged hemodynamic response across all subjects, sessions, and trials revealed two notable patterns.
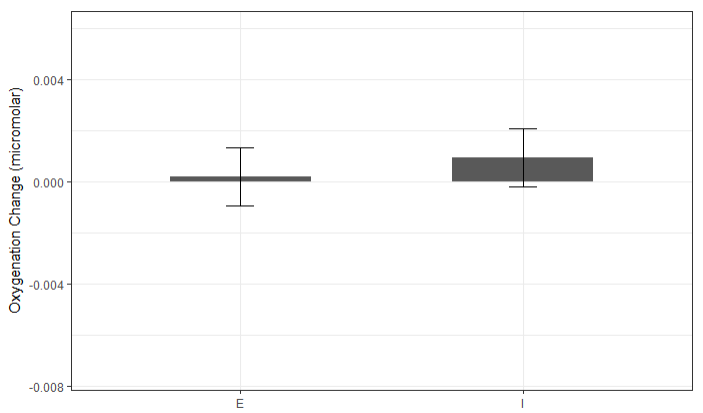
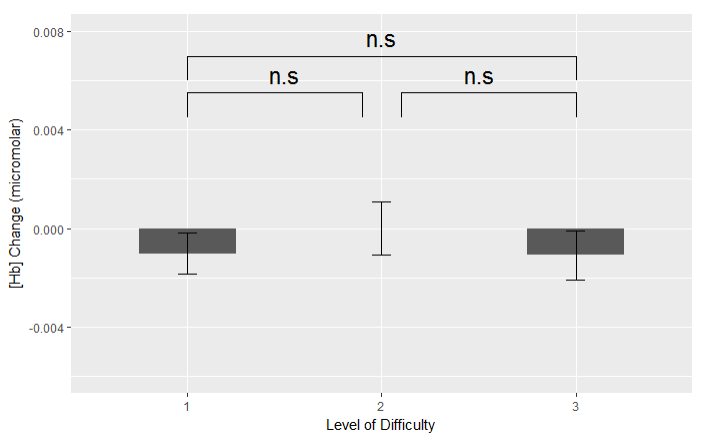
Inverted hemodynamic trend. The dominant pattern was a decrease in [HbO] (rather than the canonical increase) and approximately unchanged [Hb], resulting in consistently negative oxygenation across all task conditions. This inverted response, while atypical relative to the cognitive workload literature (which usually observes positive \(\Delta[\text{HbO}]\)), has been reported before and is associated with a negative BOLD response in fMRI. Critically, all four subjects manifested this pattern, ruling out individual outlier effects.
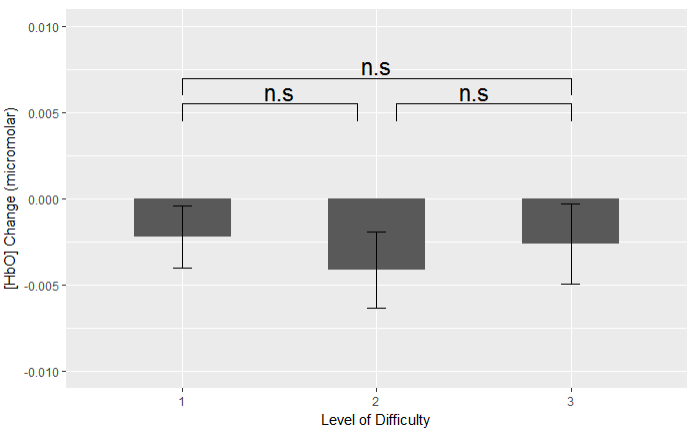
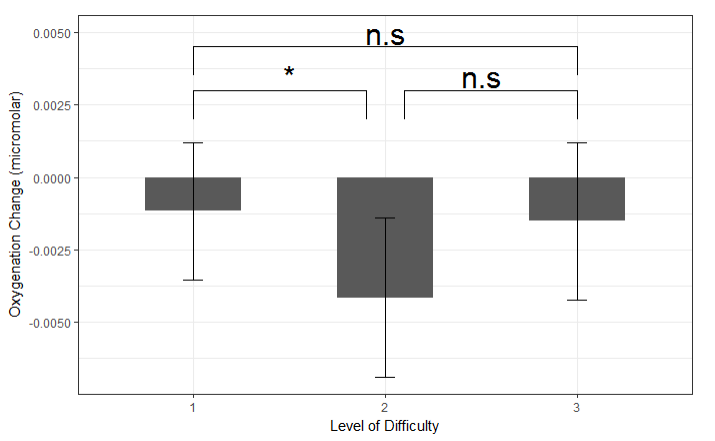
Mean oxygenation values across difficulty levels:
| Level | Mean Oxygenation | Std |
|---|---|---|
| 1 | -0.0012 | 0.00601 |
| 2 | -0.0041 | 0.00667 |
| 3 | -0.0015 | 0.00673 |
Non-monotonic response at peak difficulty. Oxygenation was most negative at Level 2, with a partial rebound at Level 3. The typical finding in the MWL literature is a monotonic relationship between difficulty and hemodynamic response. The rebound at Level 3 is consistent with findings by Izzetoglu et al. (Izzetoglu et al., 2004) in air warfare simulations, where oxygenation dropped at the most demanding condition due to participant disengagement once the task exceeded their performance ceiling. We hypothesize the same mechanism applies here: subjects mentally disengaged at Level 3 because its difficulty was far beyond their current skill level at this early training stage.
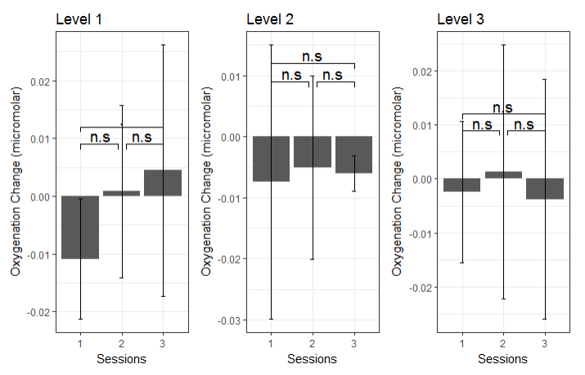
Analysis Across Sessions
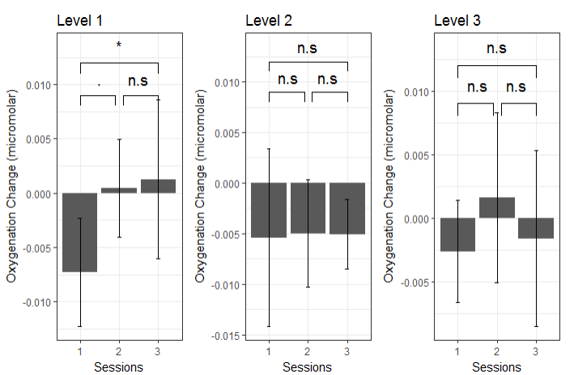
To investigate whether fNIRS tracks learning over time, I analyzed oxygenation changes, accuracy, and NASA-TLX scores grouped by difficulty level across the three feedback sessions.
A significant change in oxygenation was found across sessions for Level 1 only (F = 6.1195, p < 0.01). Levels 2 and 3 showed no significant session effect. Accuracy followed a similar pattern: Level 1 improved from session 1 (29%, below the 33% chance level) to session 2 (40.3%), then stabilized. NASA-TLX scores, by contrast, remained essentially flat across all sessions and difficulty levels.
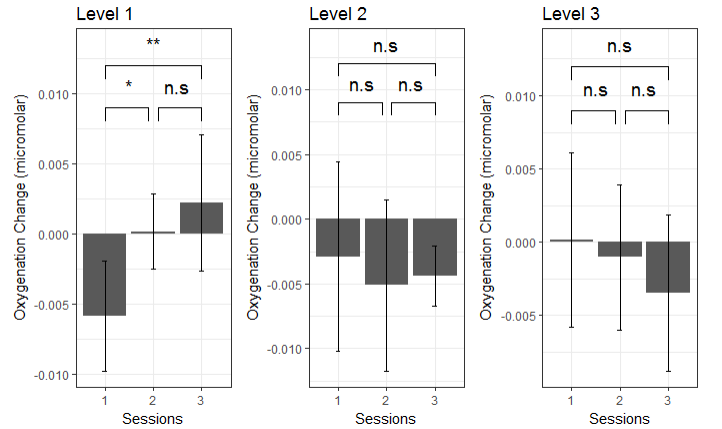
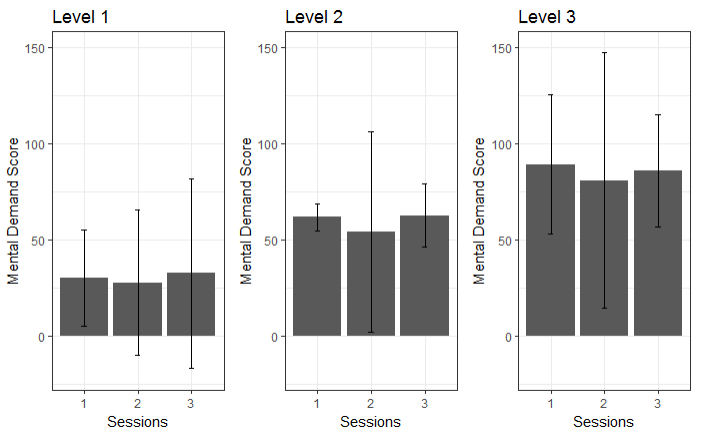
This is the sharpest finding in the study: fNIRS detected early-stage learning that NASA-TLX could not. In Level 1, oxygenation became less negative across sessions as subjects gained control, mirroring the accuracy improvement. Subjective workload ratings showed none of this.
| Session | Level 1 Mean (%) | Level 2 Mean (%) | Level 3 Mean (%) |
|---|---|---|---|
| 1 | 29.00 | 20.75 | 17.25 |
| 2 | 40.33 | 24.63 | 12.44 |
| 3 | 41.22 | 21.67 | 19.56 |
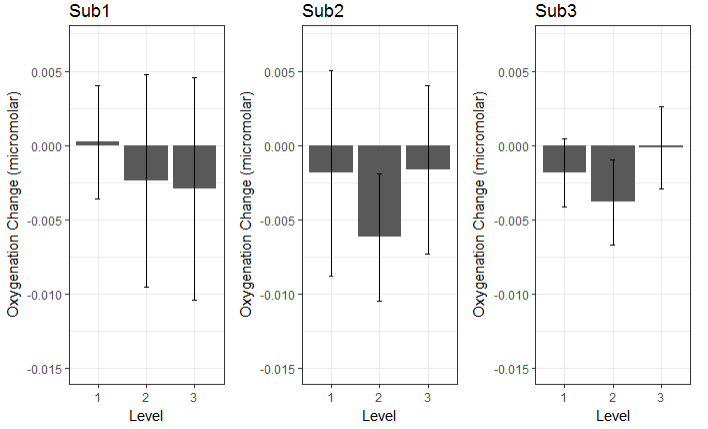
Individual Analysis: Naive Subjects
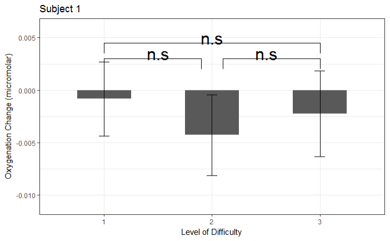
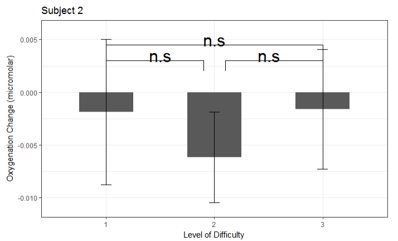
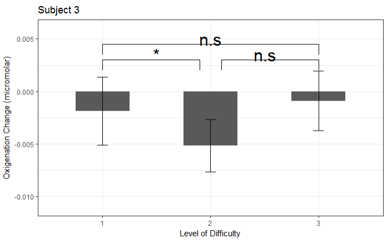
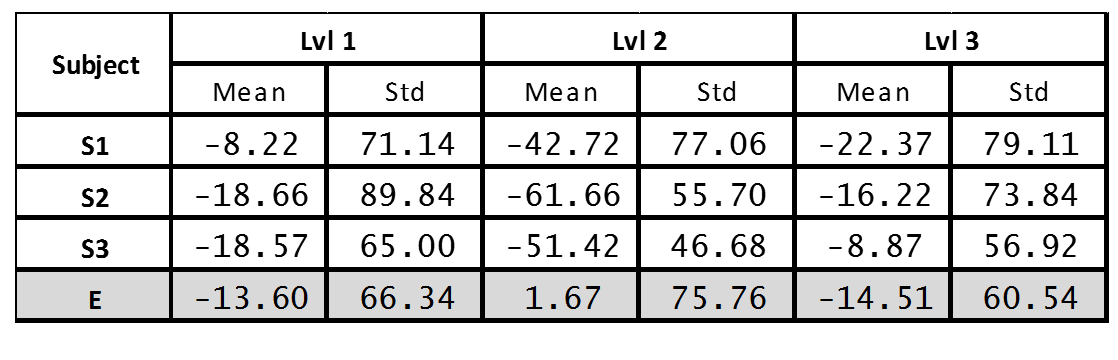
Examining subjects individually confirmed a consistent pattern across all three naive participants: oxygenation dropped from Level 1 to Level 2, then partially rebounded at Level 3. Although the omnibus one-way ANOVA was not significant across subjects, targeted one-tailed t-tests based on the hypothesized disengagement pattern were significant for Subject 3 (p < 0.05).
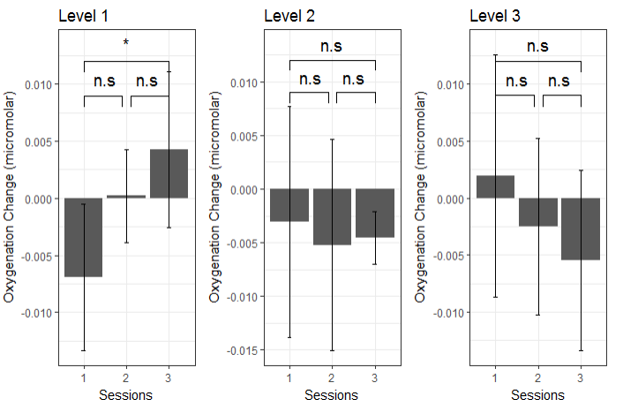
The interaction between difficulty level and session was also consistent: within Level 1, oxygenation change was significant across sessions for all naive subjects (reflecting learning), while Levels 2 and 3 remained stable.
Individual Analysis: Expert Subject
The expert participant presented a strikingly different profile. Performance was significantly higher across all difficulty levels compared to naive subjects (p < 0.05 in all conditions).
Despite superior performance, the expert’s fNIRS signals across all difficulty levels were low and did not differ significantly between conditions. In contrast, the expert’s NASA-TLX Mental Demand scores were only marginally lower than those of naive participants, a gap disproportionately small relative to the performance difference.
This pattern is consistent with task automaticity: after extensive training, the brain’s executive control resources are less heavily recruited, enabling superior performance at lower metabolic cost in the PFC. Importantly, fNIRS captured this expertise-related distinction far more clearly than NASA-TLX.
Conclusion
This study provides the first evidence that fNIRS over the prefrontal cortex is responsive to the mental demands of SMR-based BCI training, tracking differences across difficulty levels, learning across sessions, and expertise, in ways that subjective self-report cannot. The key findings are:
- Motor imagery alone does not generate detectable PFC workload differences relative to motor execution, in the static calibration setting without feedback.
- Adaptive feedback BCI training induces PFC oxygenation changes that track task difficulty and participant engagement, with a non-monotonic rebound at peak difficulty consistent with task disengagement.
- fNIRS detected early-stage learning (oxygenation normalization at Level 1 across sessions) that NASA-TLX did not, suggesting higher sensitivity to the neural correlates of motor skill acquisition.
- Expert BCI users show uniformly low PFC activity across difficulty levels, consistent with task automaticity, while subjective ratings showed only marginal separation from naive users.
The results support fNIRS as a complementary sensing modality in future hybrid BCI systems that adapt training difficulty online based on the user’s real-time cognitive state, moving beyond current approaches that rely on subjective report or performance alone.
References
2015
2014
- Brain-Computer Interfaces Using Sensorimotor Rhythms: Current State and Future PerspectivesIEEE Transactions on Biomedical Engineering, 2014
2013
- Transferring BCI skills to successful application controls2013
2012
2011
2009
2008
- Discrimination of Mental Workload Levels in Human Subjects with Functional Near-Infrared SpectroscopyJournal of Innovative Optical Health Sciences, 2008
2004
- BCI2000: a general-purpose brain-computer interface (BCI) systemIEEE Transactions on Biomedical Engineering, 2004
- Functional Optical Brain Imaging Using Near-Infrared During Cognitive TasksInternational Journal of Human-Computer Interaction, 2004
1997
- Non-invasive optical spectroscopy and imaging of human brain functionTrends in Neurosciences, 1997
1991
- The development of a near infrared spectroscopy system and its application for non invasive monitoring of cerebral blood and tissue oxygenation in the newborn infantsUniversity College London, 1991