EyeNote
Clinical Information Extraction for Ophthalmology
Foreword
This article documents the continuously evolving findings of my PhD thesis, which explores Natural Language Processing methods for clinical text in ophthalmology. It is not a finished work; the project continues to grow and accumulate new findings over time.
How does an ophthalmic clinical corpus look like?
The corpus used in this work consists of clinical letters extracted from the electronic health records (EHR) of Moorfields Eye Hospital NHS Trust (MEH), the largest specialist eye hospital in the UK. Letters were extracted from September 2012 through August 2024, de-identified using MedCAT (Kormilitzin et al., 2021), and converted from RTF/HTML to plain text. Of 8,422,536 attended visits on record, 6,135,939 (72.9%) had an associated clinical letter, yielding 6,350,195 letters in total. After matching letters to their corresponding visits using a 30-day date threshold, 5,814,876 letters (91.6%) were retained for analysis.
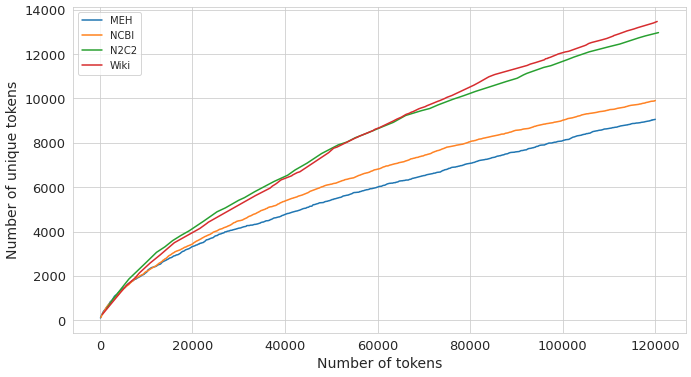
A natural first question when working with any corpus is how lexically rich it is. A corpus with a large, rapidly growing vocabulary benefits more from domain-specific language model pre-training than one that recycles the same narrow set of terms. Heaps’ law (Heaps, 1978) provides a principled way to measure this: it models vocabulary size $V(n)$ as a function of total token count $n$ via $V(n) = k \cdot n^\beta$, where the exponent $\beta$ captures how quickly new words appear. A higher $\beta$ means the vocabulary keeps growing; a lower $\beta$ means it plateaus early.
As shown in Figure 1, MEH letters have $\beta = 0.625$, the lowest among four corpora compared (NCBI-Disease (Doğan et al., 2014): 0.638; N2C2/MIMIC-III (Henry et al., 2020; Johnson et al., 2016): 0.69; WikiSection: 0.715). The domain-specific vocabulary of ophthalmology saturates relatively quickly, which partly explains why pre-training a language model on MEH text alone yields diminishing returns beyond a certain scale.
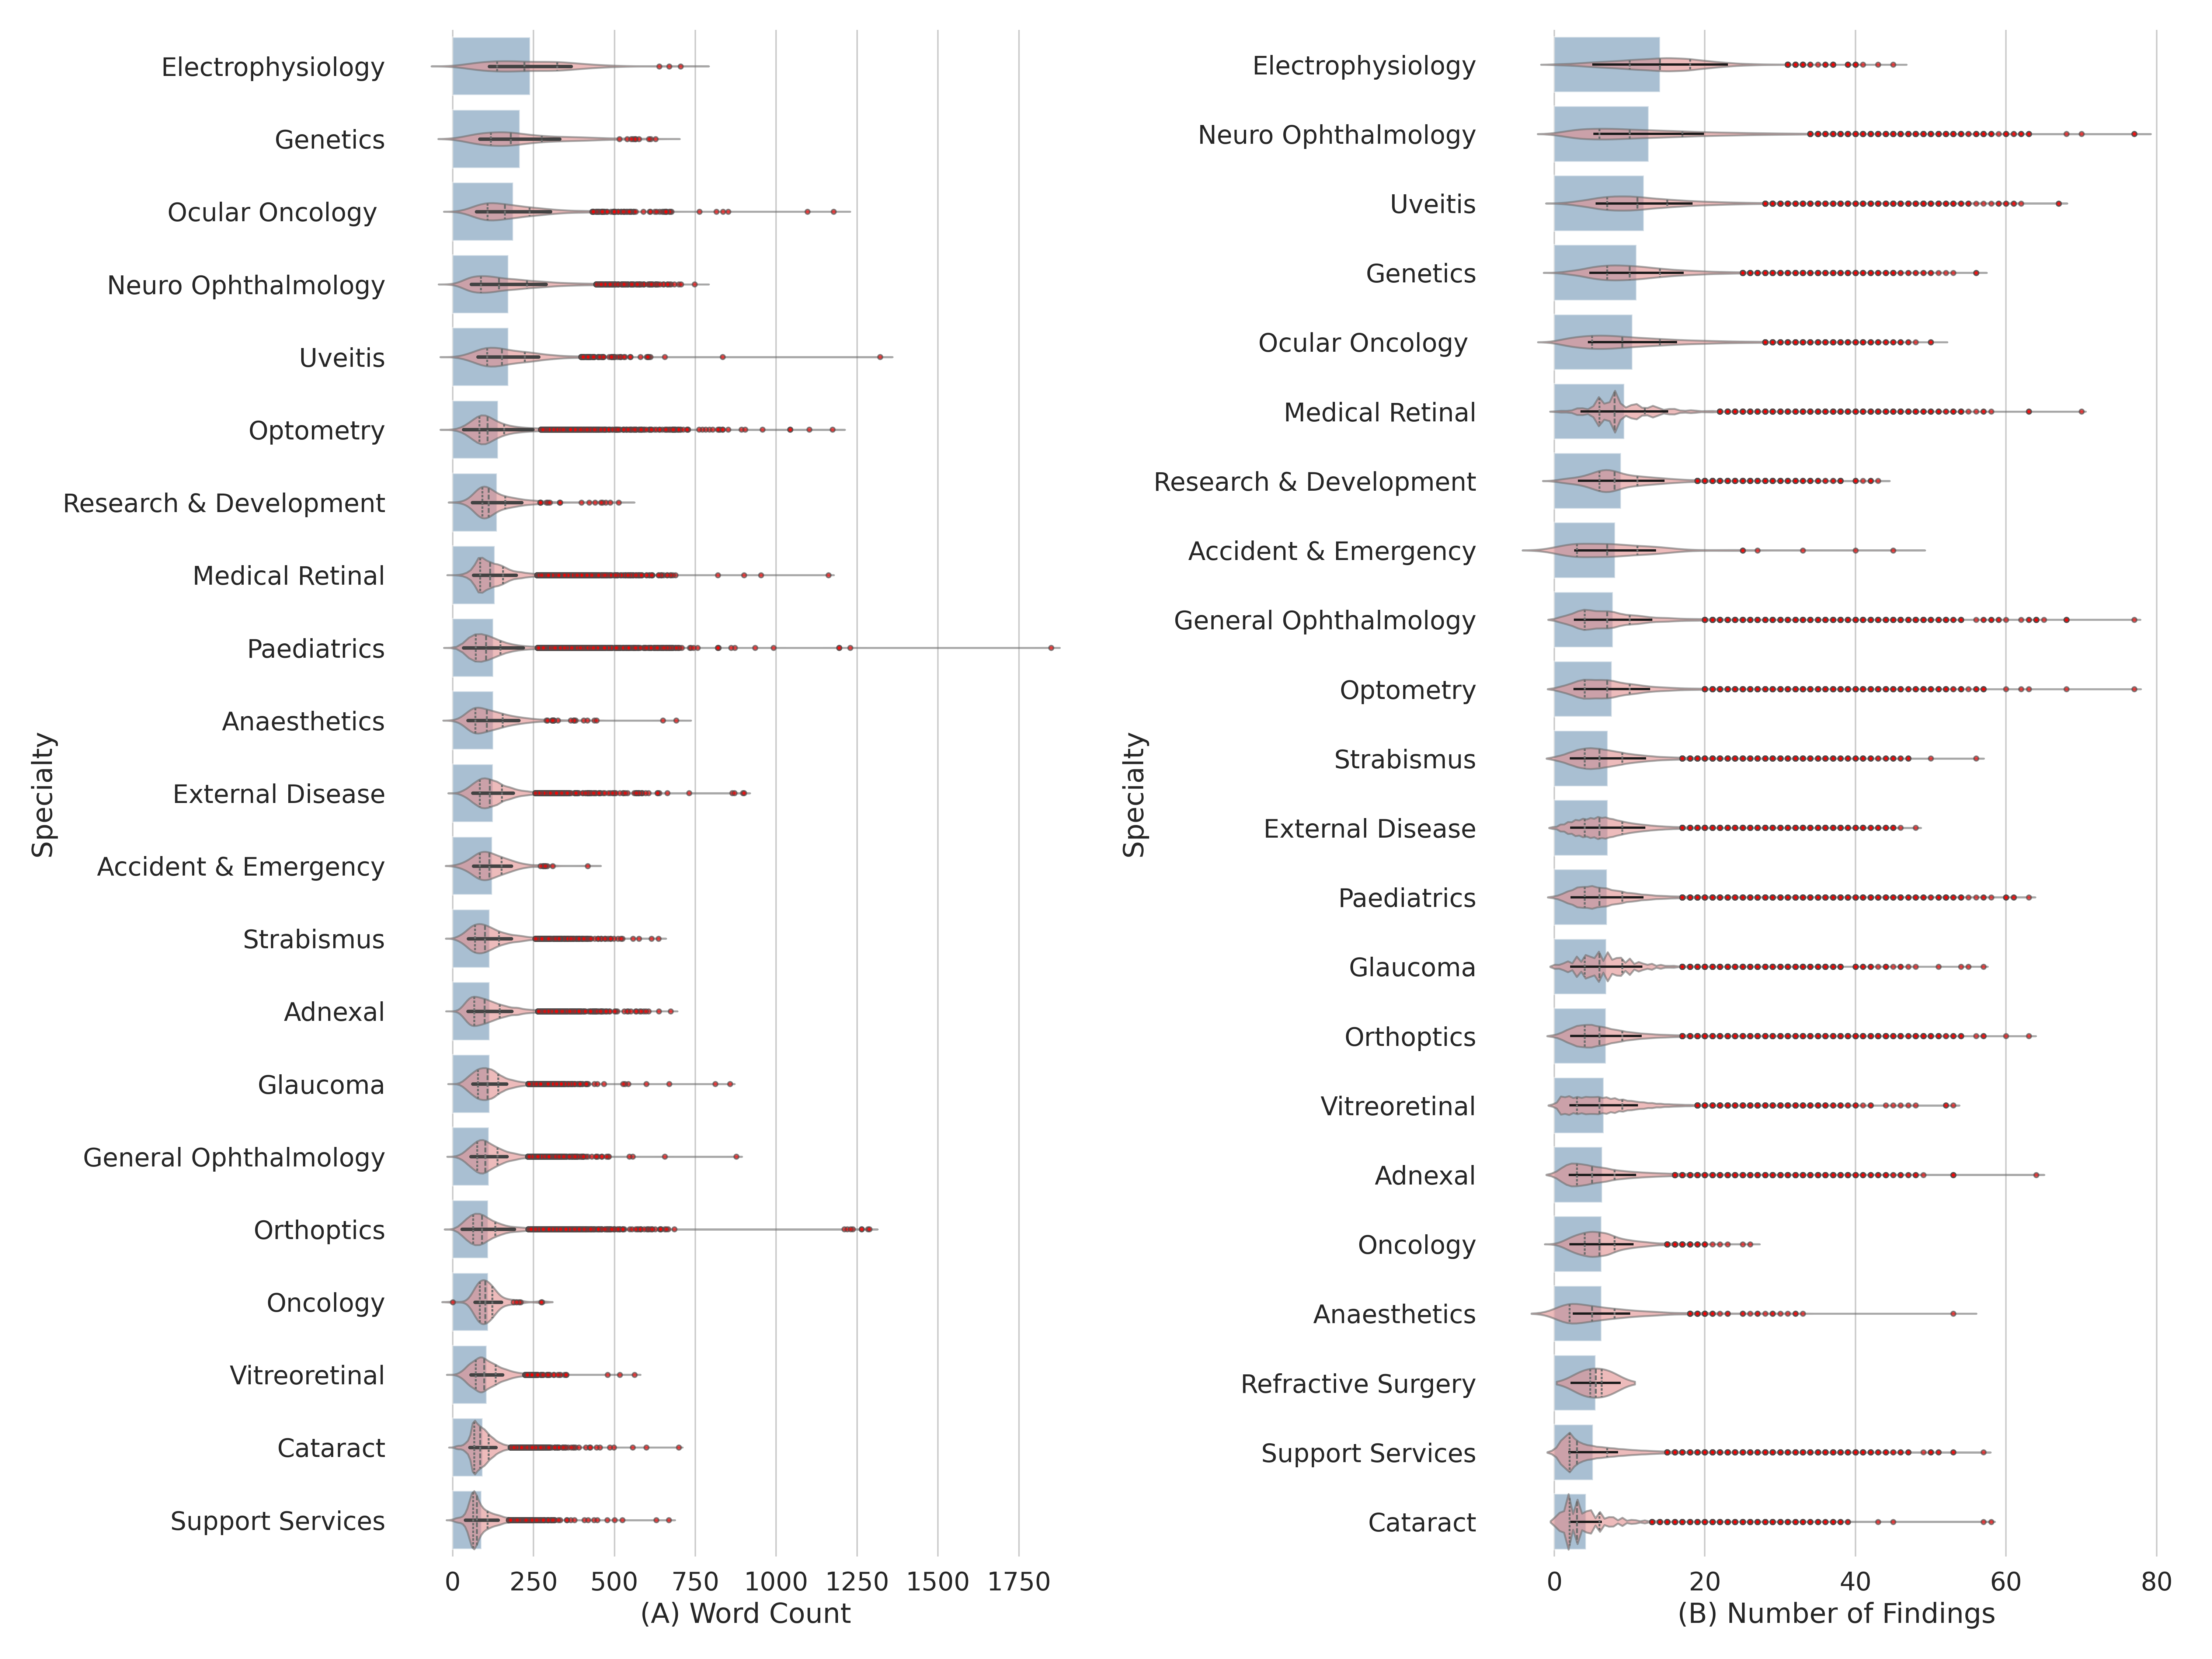
Documentation style varies substantially across ophthalmology subspecialties. To quantify this, letter length (token count) and the number of unique clinical findings per letter were extracted across 21 subspecialties using NLTK tokenization (Bird et al., 2009) and SemEHR (Wu et al., 2018) semantic entity extraction respectively. The results, shown in Figure 2, reveal two broad clusters. Complex, investigation-heavy specialties such as Electrophysiology, Neuro-Ophthalmology, Genetics, and Ocular Oncology produce verbose, semantically dense letters (around 175-275 tokens, 12-14 clinical findings on average). High-volume procedural specialties such as Cataract and Support Services use concise, standardized notes (under 100 tokens, 4-6 findings). Some specialties break the pattern: Pediatrics letters are long but finding-sparse, reflecting the developmental history that dominates these notes, while Optometry letters are lengthy but not particularly dense in clinical findings, suggesting standardized patient instruction content.
How much clinical information is locked in clinical narratives?
To answer this concretely, we focused on visual acuity (VA), arguably the single most important measurement in ophthalmology and one routinely recorded at every clinic visit. VA can be documented either in the free-text clinical letter or entered directly into the structured fields of the EHR. By running a VA extraction tool over the letter corpus and comparing results against the structured database, we can estimate what fraction of VA measurements exist only in narrative form, inaccessible to any query that reads structured data alone.
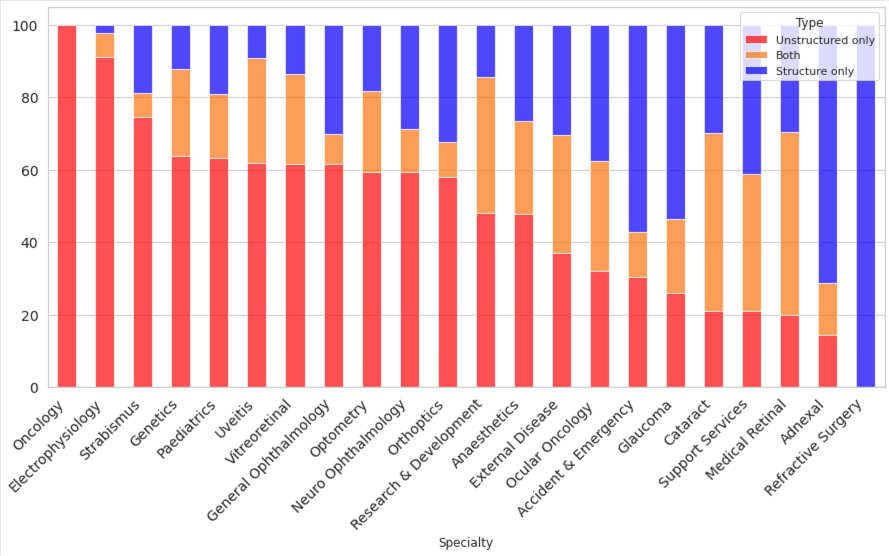
Across the full corpus, 68% of visits had VA documented somewhere in unstructured text, and critically, 35% of visits had VA recorded exclusively in unstructured letters, with no corresponding structured entry. As Figure 3 shows, this varies sharply by subspecialty: Ocular Oncology operates almost entirely in unstructured text (close to 100%), while specialties such as Refractive Surgery have moved to nearly fully structured recording. Electrophysiology, Strabismus, and several others retain strong unstructured-only majorities.
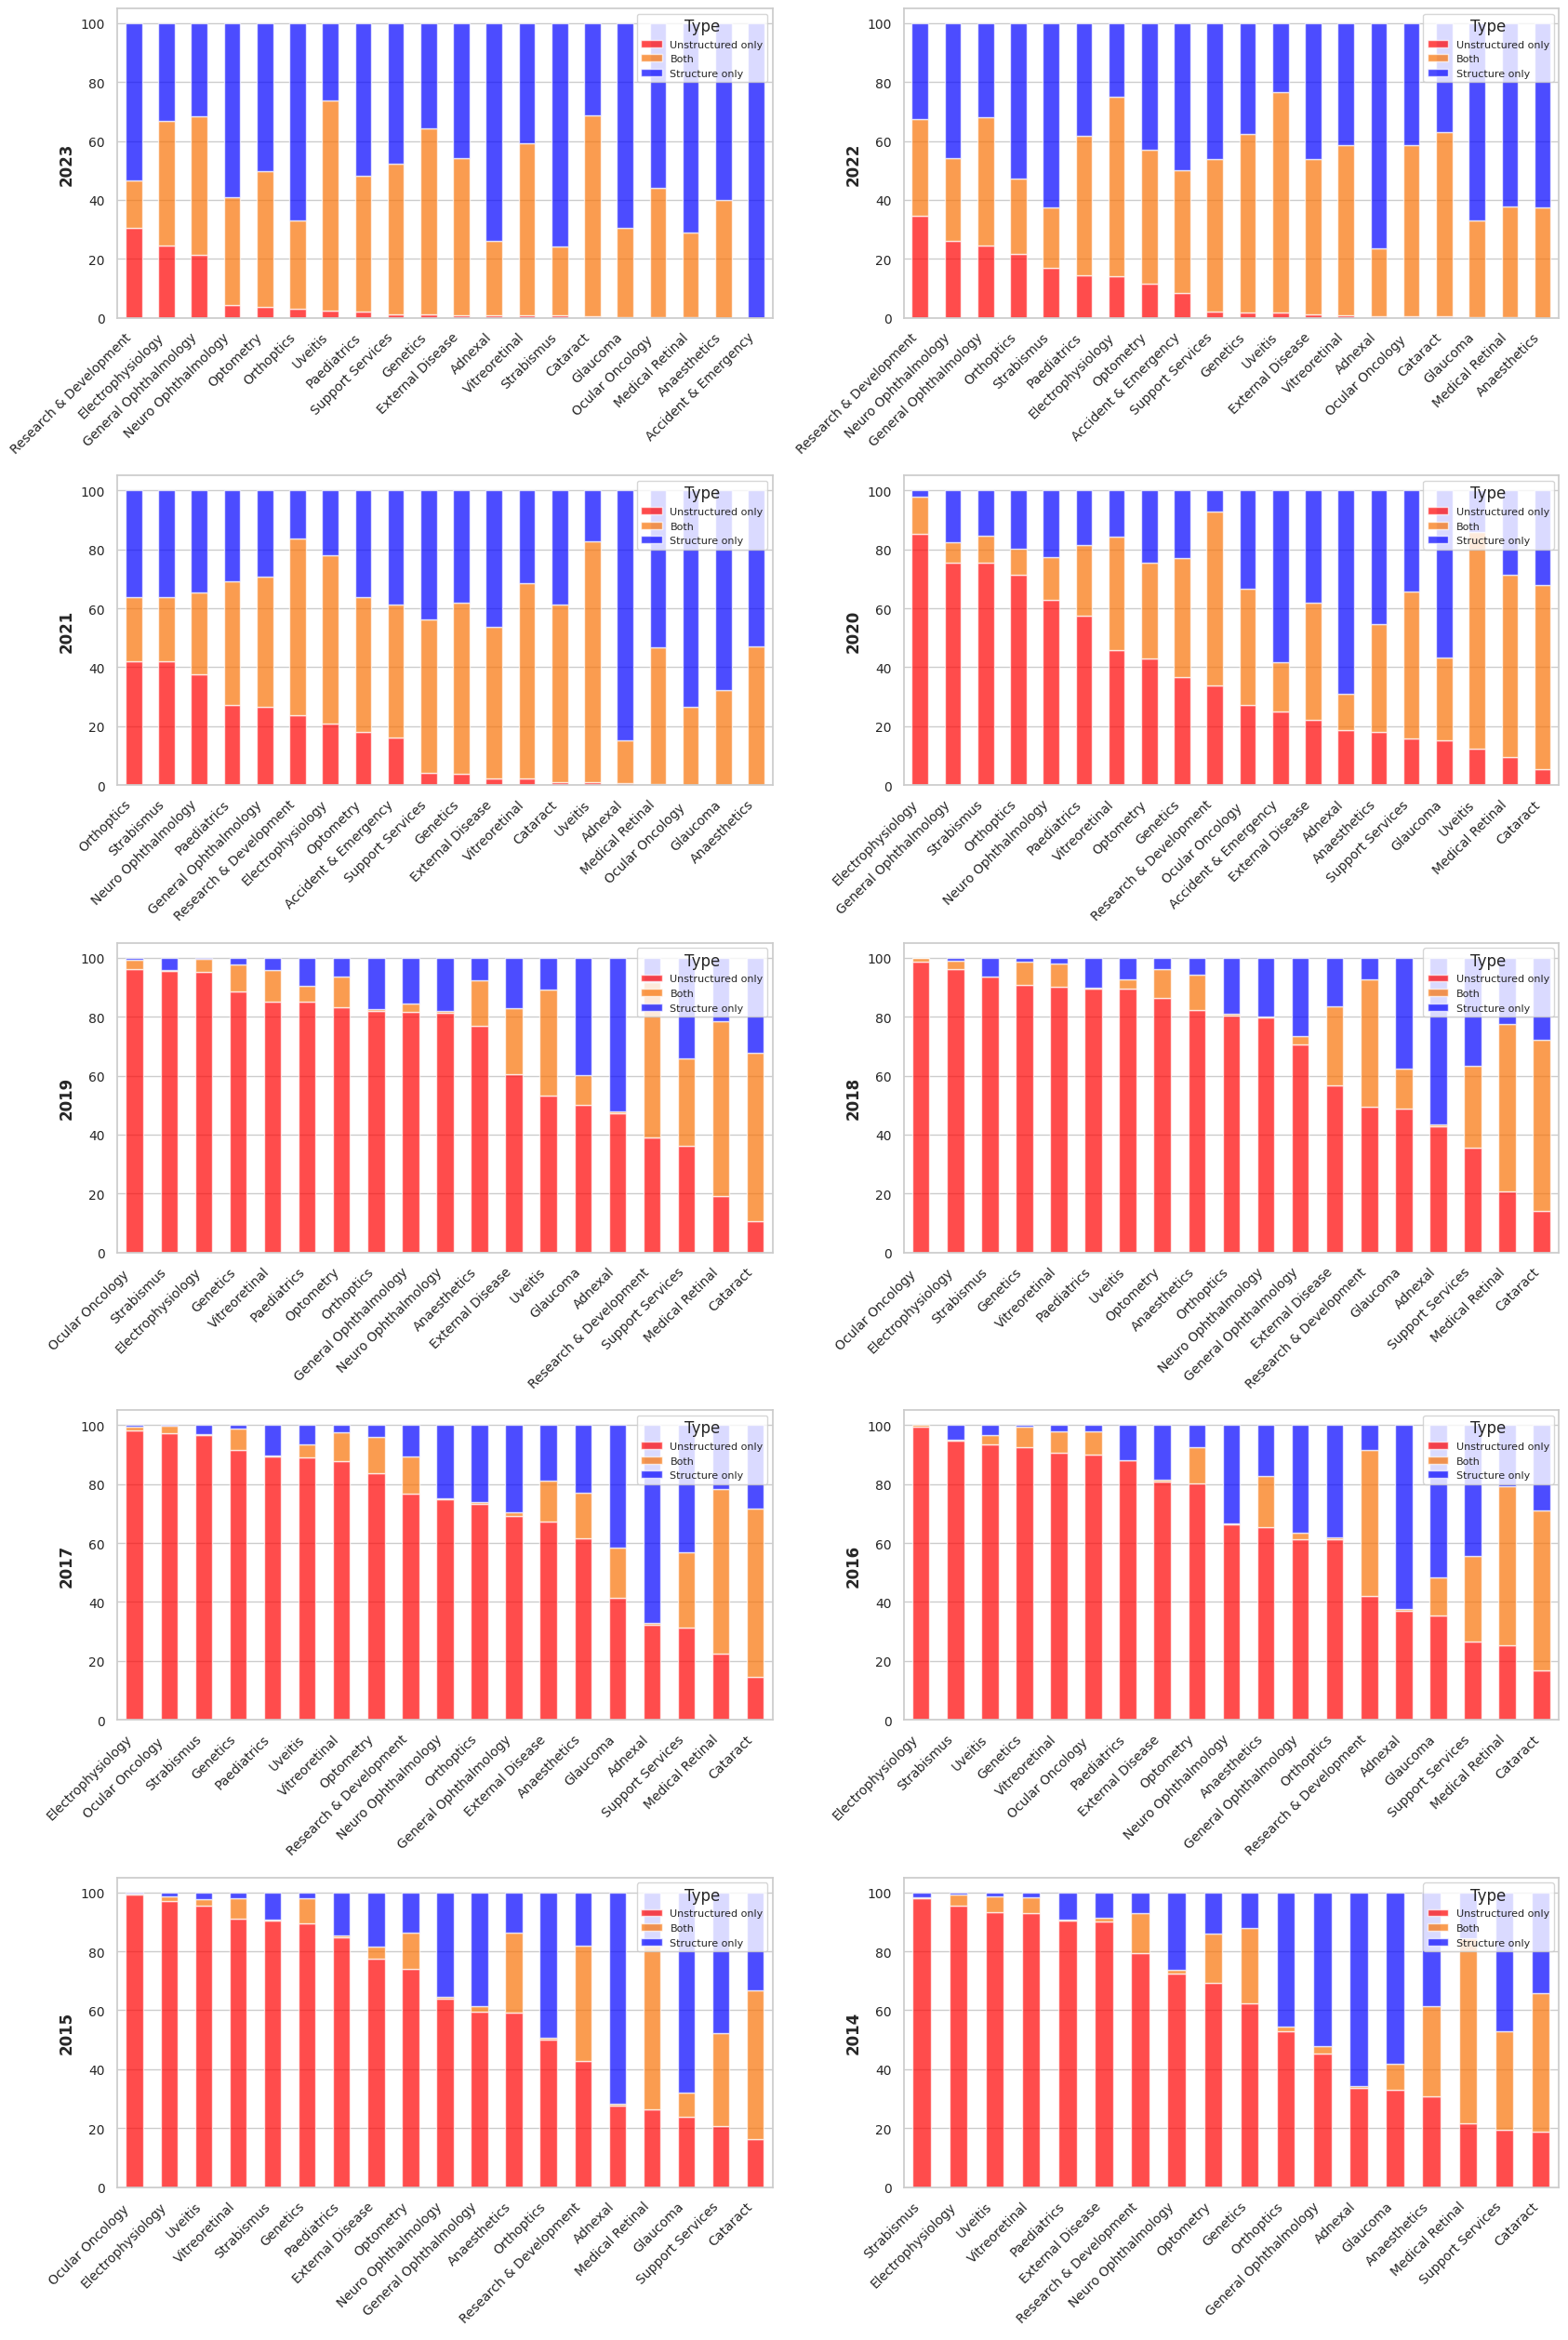
This picture changes substantially when viewed over time. Figure 4 traces the same breakdown annually from 2013 to 2023. Before 2019, the vast majority of subspecialties relied almost exclusively on unstructured letters for VA. A clear inflection point emerges around 2020-2021, coinciding with EHR upgrades and, likely, the operational pressures of the COVID-19 pandemic accelerating adoption of structured data entry. By 2023, hybrid or structured-only recording dominates in high-volume specialties such as Glaucoma, Cataract, and Medical Retina. However, complex and subspecialized services including Neuro-Ophthalmology, Uveitis, and Strabismus continue to rely heavily on narrative text.
Taken together, these findings make the case for information extraction clearly: even for the most routinely measured clinical variable in ophthalmology, a third of the record exists only in free text. For rarer findings, more nuanced assessments, or historical data predating the structured data era, the fraction locked in narratives is considerably higher.
Adapting LM to ophthalmology: does pre-training BERT still work?
At the start of my PhD (late 2021 - early 2022), the prevailing method to adapt a language model (yes, BERT was considered a Large Language Model at the time) was to pre-train BERT on a large corpus of text in the target domain using semi-supervised techniques such as Masked Language Modeling (MLM) or Next Sentence Prediction (NSP). As shown in the previous sections, the ophthalmic corpus exhibits quite unique characteristics that would suggest models could benefit from domain adaptation. To our surprise, it was not what it turned out to be.
EyeBERT
We pre-trained two variants of BERT on 5.8 million MEH clinical letters (approximately 700M words, 4.8 GB):
- EyeBERT(scratch): trained from random weight initialization
- EyeBERT(PBM): continually pre-trained from PubMedBERT
Both were evaluated against BERT (Devlin et al., 2018), BioBERT (Lee et al., 2019), ClinicalBERT (Alsentzer et al., 2019), DistilBERT (Sanh et al., 2019), and PubMedBERT (Gu et al., 2021) on two named entity recognition (NER) tasks: recognizing clinical phenotypes in eye-related PubMed case reports, and in MEH clinical letters.
NER Results
Table 1 and Table 2 report partial and strict F1 scores on the PubMed and MEH test sets respectively.
| Model | Partial | Strict | ||||
|---|---|---|---|---|---|---|
| P | R | F1 | P | R | F1 | |
| SemEHR (baseline) | 97.29 | 72.50 | 83.09 | 97.25 | 72.47 | 83.05 |
| BERT | 55.11 | 67.39 | 60.63 | 47.59 | 58.21 | 52.37 |
| BioBERT | 58.62 | 73.33 | 65.16 | 51.41 | 64.30 | 57.14 |
| ClinicalBERT | 53.29 | 66.58 | 59.20 | 44.69 | 55.83 | 49.64 |
| DistilBERT | 52.59 | 64.40 | 57.90 | 43.42 | 53.17 | 47.80 |
| PubMedBERT | 80.91 | 90.88 | 85.61 | 78.79 | 88.51 | 83.37 |
| EyeBERT(scratch) | 79.48 | 89.01 | 83.97 | 77.89 | 87.23 | 82.30 |
| EyeBERT(PBM) | 86.58 | 93.31 | 89.82 | 84.84 | 91.44 | 88.02 |
| Model | Partial | Strict | ||||
|---|---|---|---|---|---|---|
| P | R | F1 | P | R | F1 | |
| SemEHR (baseline) | 51.56 | 32.57 | 39.92 | 44.82 | 28.31 | 34.70 |
| BERT | 52.42 | 63.44 | 57.41 | 42.29 | 51.19 | 46.31 |
| BioBERT | 57.66 | 65.60 | 61.37 | 47.56 | 54.11 | 50.62 |
| ClinicalBERT | 56.60 | 65.83 | 60.86 | 45.89 | 53.37 | 49.35 |
| DistilBERT | 52.36 | 63.94 | 57.57 | 41.06 | 50.15 | 45.15 |
| PubMedBERT | 62.07 | 65.09 | 63.55 | 54.21 | 56.85 | 55.50 |
| EyeBERT(scratch) | 49.35 | 59.42 | 53.92 | 42.52 | 51.20 | 46.46 |
| EyeBERT(PBM) | 56.11 | 65.71 | 60.53 | 48.91 | 57.27 | 52.76 |
The results tell a clear but counterintuitive story. On PubMed data, EyeBERT(PBM) is the best model overall (partial F1: 89.82%), and EyeBERT(scratch) is also competitive. But on the MEH clinical letters, the very domain EyeBERT was trained on, PubMedBERT wins (partial F1: 63.55%), and EyeBERT(scratch) is actually the weakest neural model (53.92%). Training from scratch on domain data did not help; if anything, it hurt.
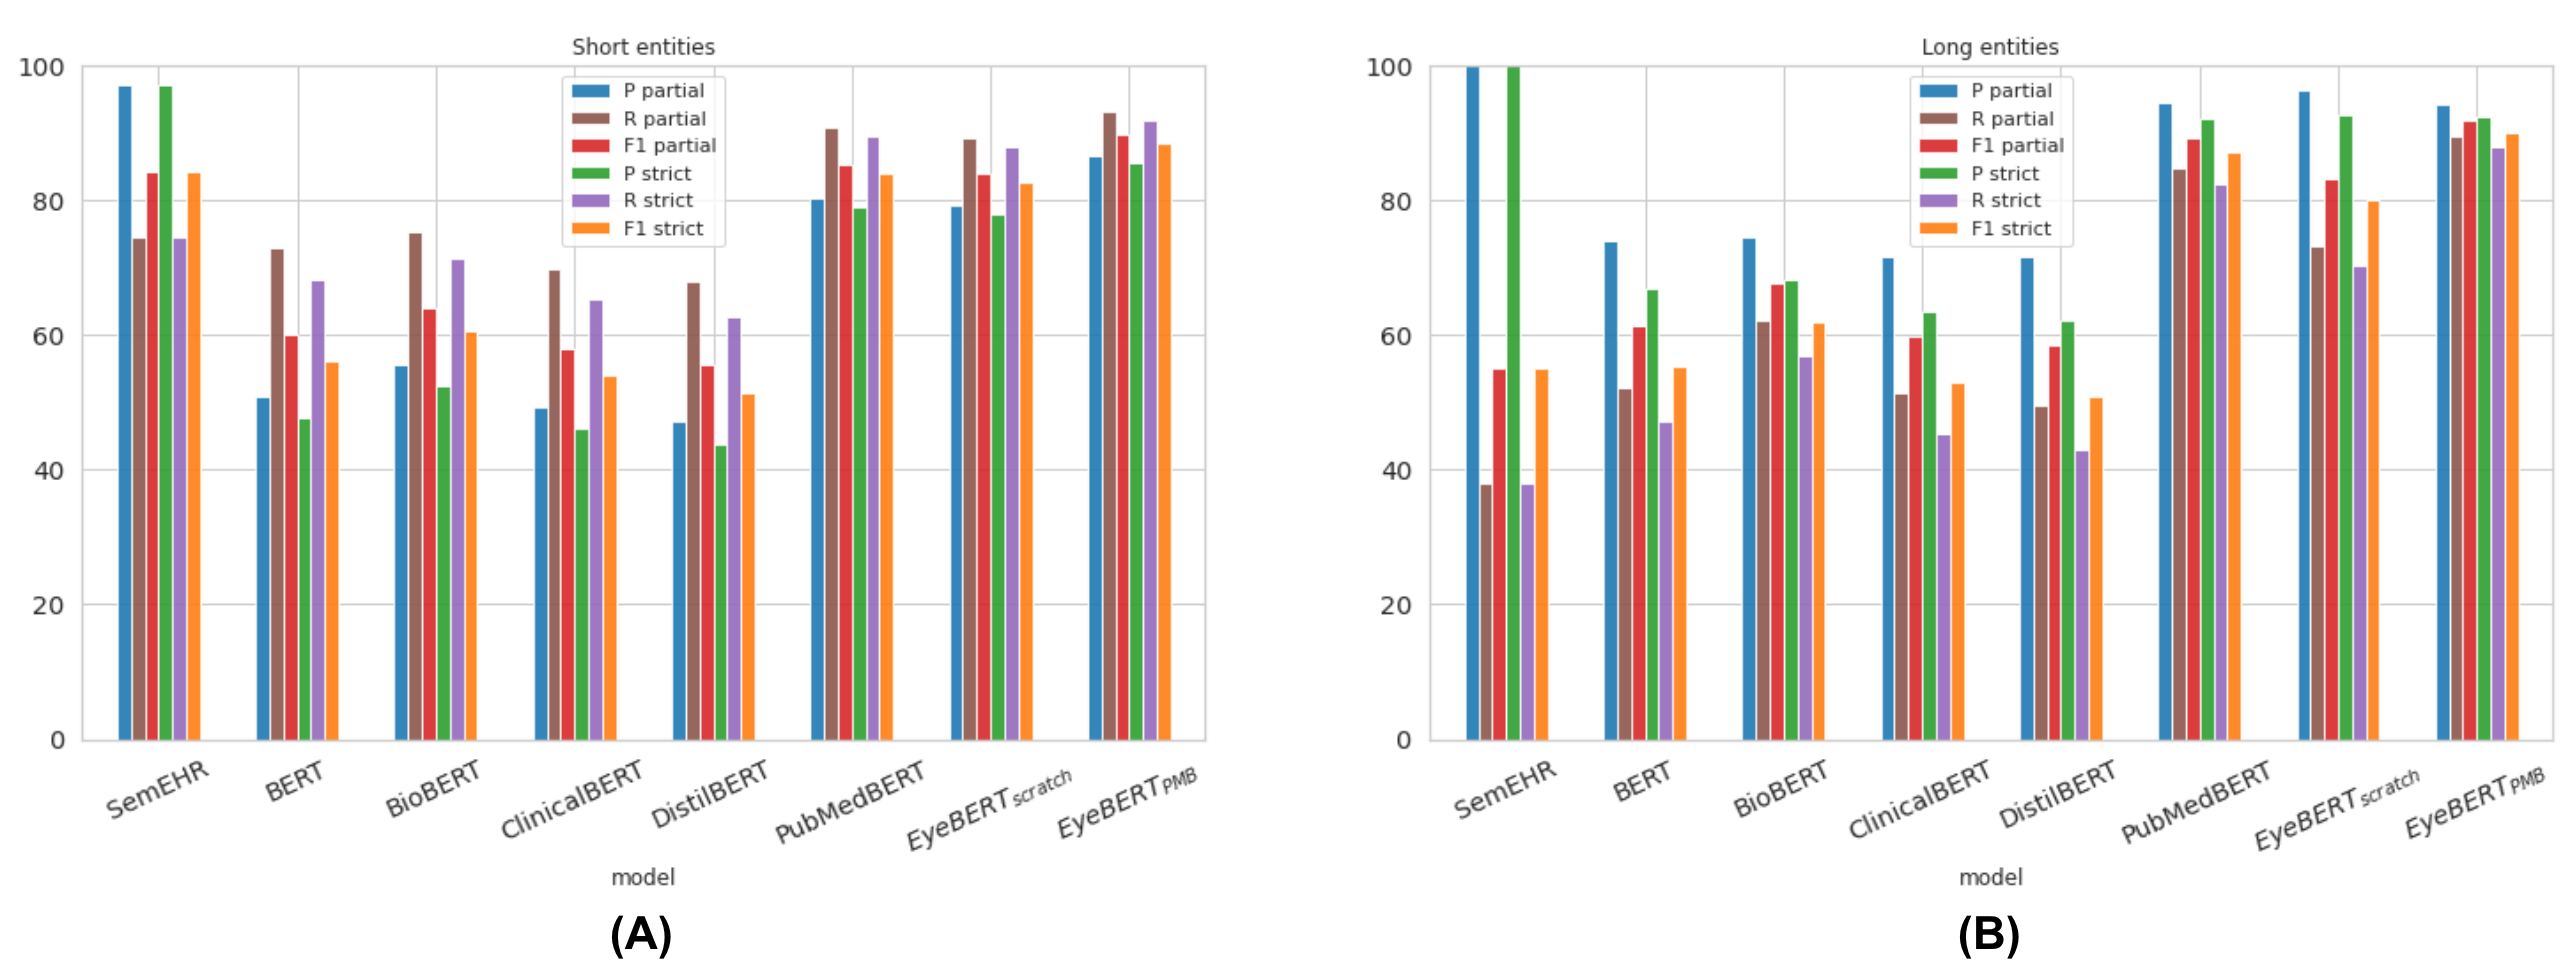
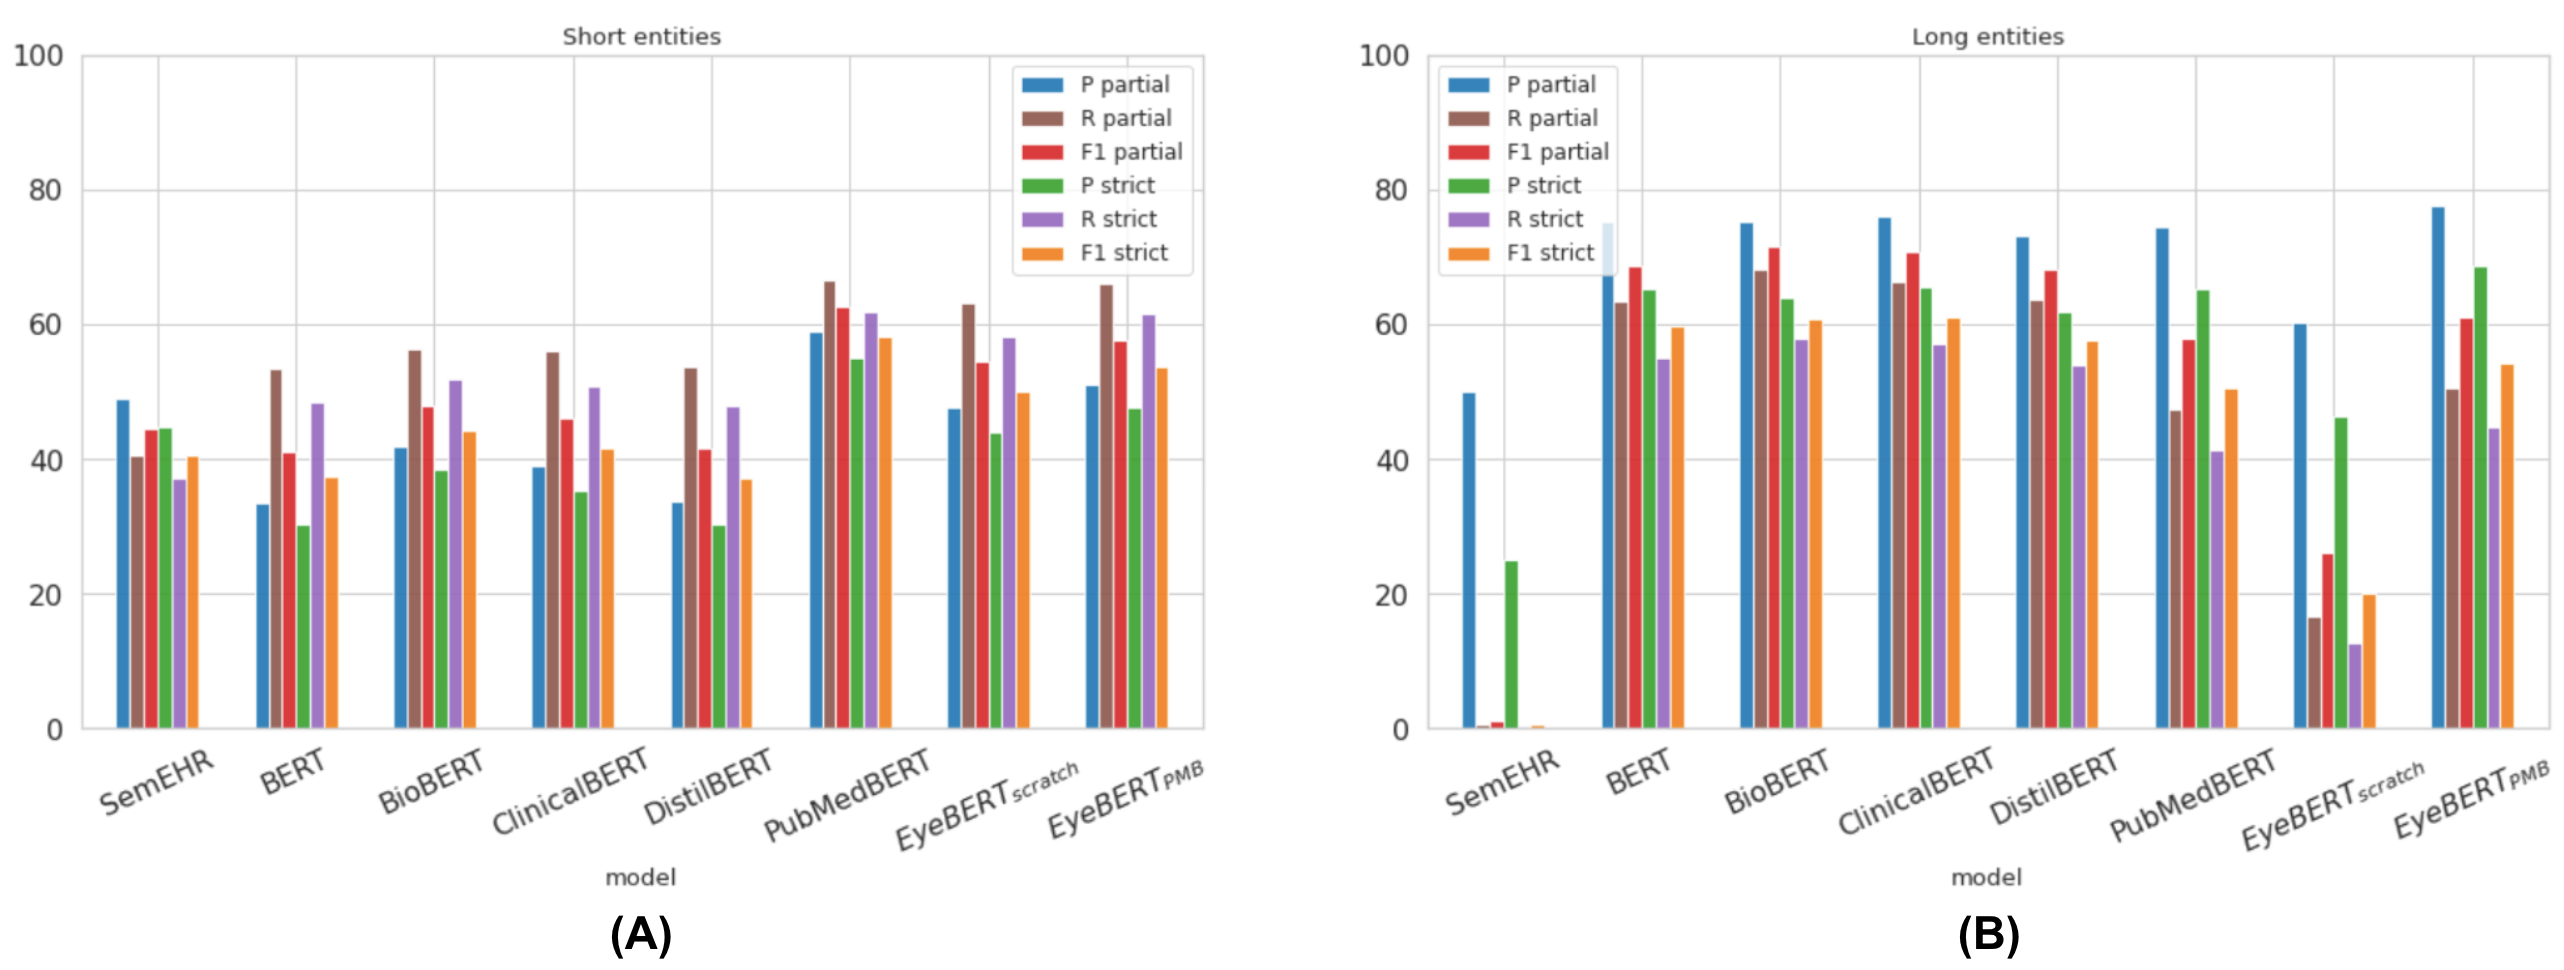
A key part of the explanation lies in entity length. MEH clinical entities are significantly longer and more complex than those in PubMed, NCBI, or BC5CDR (mean 2.71 words vs. 1.98 in PubMed). As shown in Figure 5 and Figure 6, this matters a lot: SemEHR’s recall on long PubMed entities collapses to 38% (from ~84% on short ones), and EyeBERT(scratch)’s partial F1 on long MEH entities drops to 26%. PubMedBERT, pre-trained on billions of tokens of biomedical text, handles long, complex entities far more robustly.
Pre-training Behaviour
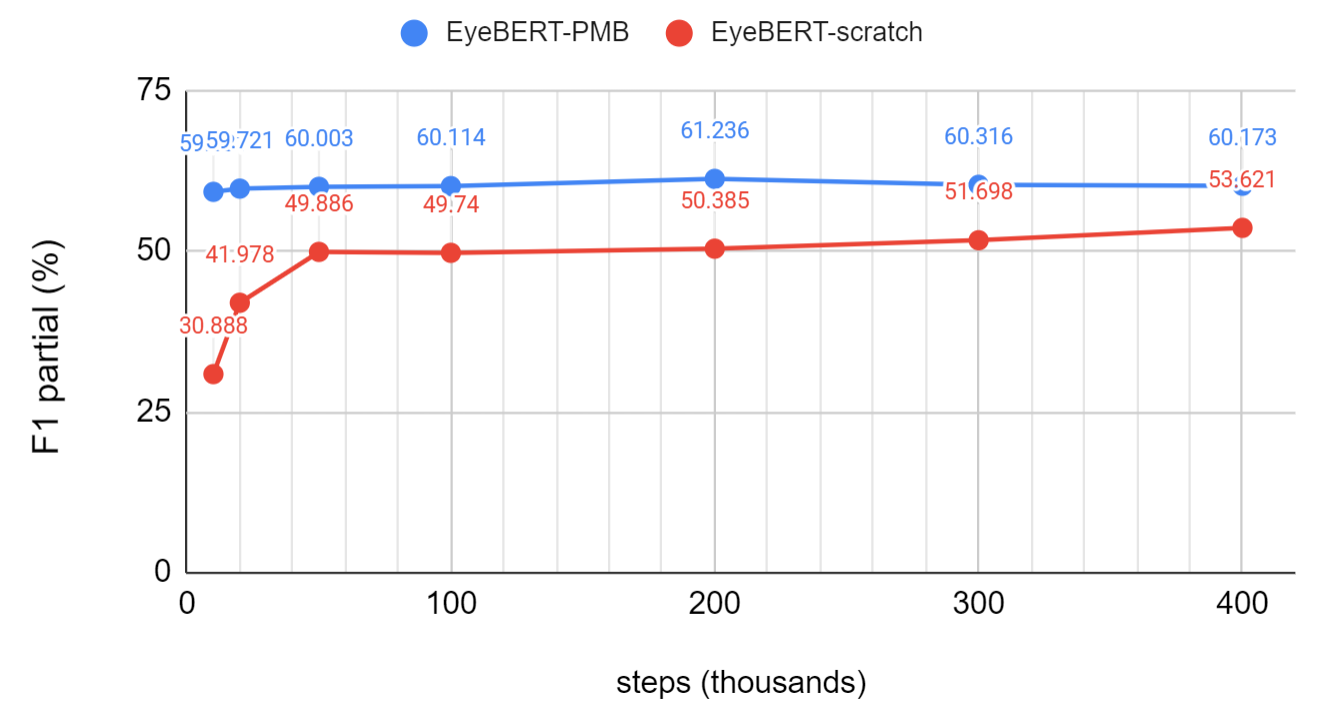
Figure 7 traces NER performance of both EyeBERT variants across pre-training steps (10K to 400K). EyeBERT(scratch) improves steeply in the first few thousand steps as it emerges from random initialization, then plateaus around 50K steps with little further gain. EyeBERT(PBM) starts from a much stronger baseline and reaches higher performance with far less additional pre-training, confirming that initialization from a large biomedical model matters more than additional domain-specific exposure.
I suspect part of the issue is probably scale. EyeBERT was pre-trained on 700M words with a batch size of 8, compared to PubMedBERT’s (Gu et al., 2021) 3.2 billion words and batch size of 8,192, and BioBERT’s (Lee et al., 2019) 18 billion words. The sheer volume of biomedical text that foundation models are exposed to equips them with a richer understanding of complex morphology and clinical syntax than any single-institution corpus can provide, at least at the scale we were able to run. The low lexical diversity of the MEH corpus, as shown by its Heaps’ law exponent of 0.625, compounds this: there simply is not enough new vocabulary for domain-specific pre-training to offer a decisive edge over a well-initialized foundation model.
Automatic Extraction of Visual Acuity
Around mid-2023, several reasons led me to the decision of building an end-to-end Visual Acuity (VA) extraction pipeline. First, in discussions with clinicians at MEH about what information they most wanted extracted from clinical narratives, VA came up consistently as the top request. As shown in the previous section, despite being the single most important variable in ophthalmology, roughly a third of VA measurements cannot be found in structured data, and the further back in time one looks, the harder VA is to recover. Without an automated tool, longitudinal studies have had to rely on painstaking manual extraction.
The second motivation is a gap in how clinical NLP research is typically reported. Studies usually evaluate NER and relation extraction (RE) in isolation on benchmark datasets, but in practice the two must be chained together to produce a usable extraction pipeline. How the models interact, and how errors in one stage propagate to the other, is rarely studied.
Pipeline
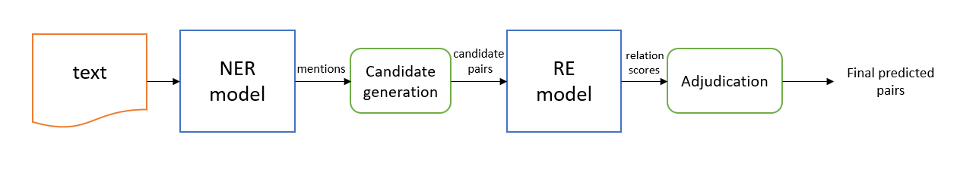
VABERT is a two-stage system. The first stage is an NER model that identifies three entity types in clinical text: VA values (e.g., “6/6”, “LogMAR 0.3”, “Hand Movement”), laterality (which eye), and correction type (aided, unaided, or pinhole). The second stage is a relation extraction (RE) model that links these entities, determining which VA value belongs to which eye and which correction type. Both stages use fine-tuned BERT (Devlin et al., 2018) with a BIO tagging scheme for NER and a marker-based approach for RE. Post-processing then standardizes all extracted values, including semi-qualitative descriptors like Counting Fingers (CF), Hand Movement (HM), and No Light Perception (NLP), to the LogMAR scale. The full pipeline is shown in Figure 8.
Extraction Performance
BioBERT achieved the best NER performance with a micro-F1 of 97.05%, more than 35 percentage points above the regex baseline (61.2%). RE is harder: the best micro-F1 is 90.80%, with the main error being positive relations misclassified as no-relation, particularly for VA-to-correction-type pairs underrepresented in training. Applied to the full 5.8 million letter corpus, VABERT identified VA in 2,425,222 letters, recovering around 52,000 more records than a keyword search would have found.
End-to-end accuracy was externally validated against a clinician-curated cohort of 836 letters from a genetic retinal disease study, reaching 82.78% for right eye and 72.37% for left eye. The gap between eyes reflects a sequential documentation bias, clinicians tend to record the right eye first, making left-eye values more susceptible to attribution errors when context is sparse.
What Can You Do With 2.4 Million VA Records?
Applying the pipeline to the full MEH corpus unlocks analyses that would be prohibitively slow to do manually.
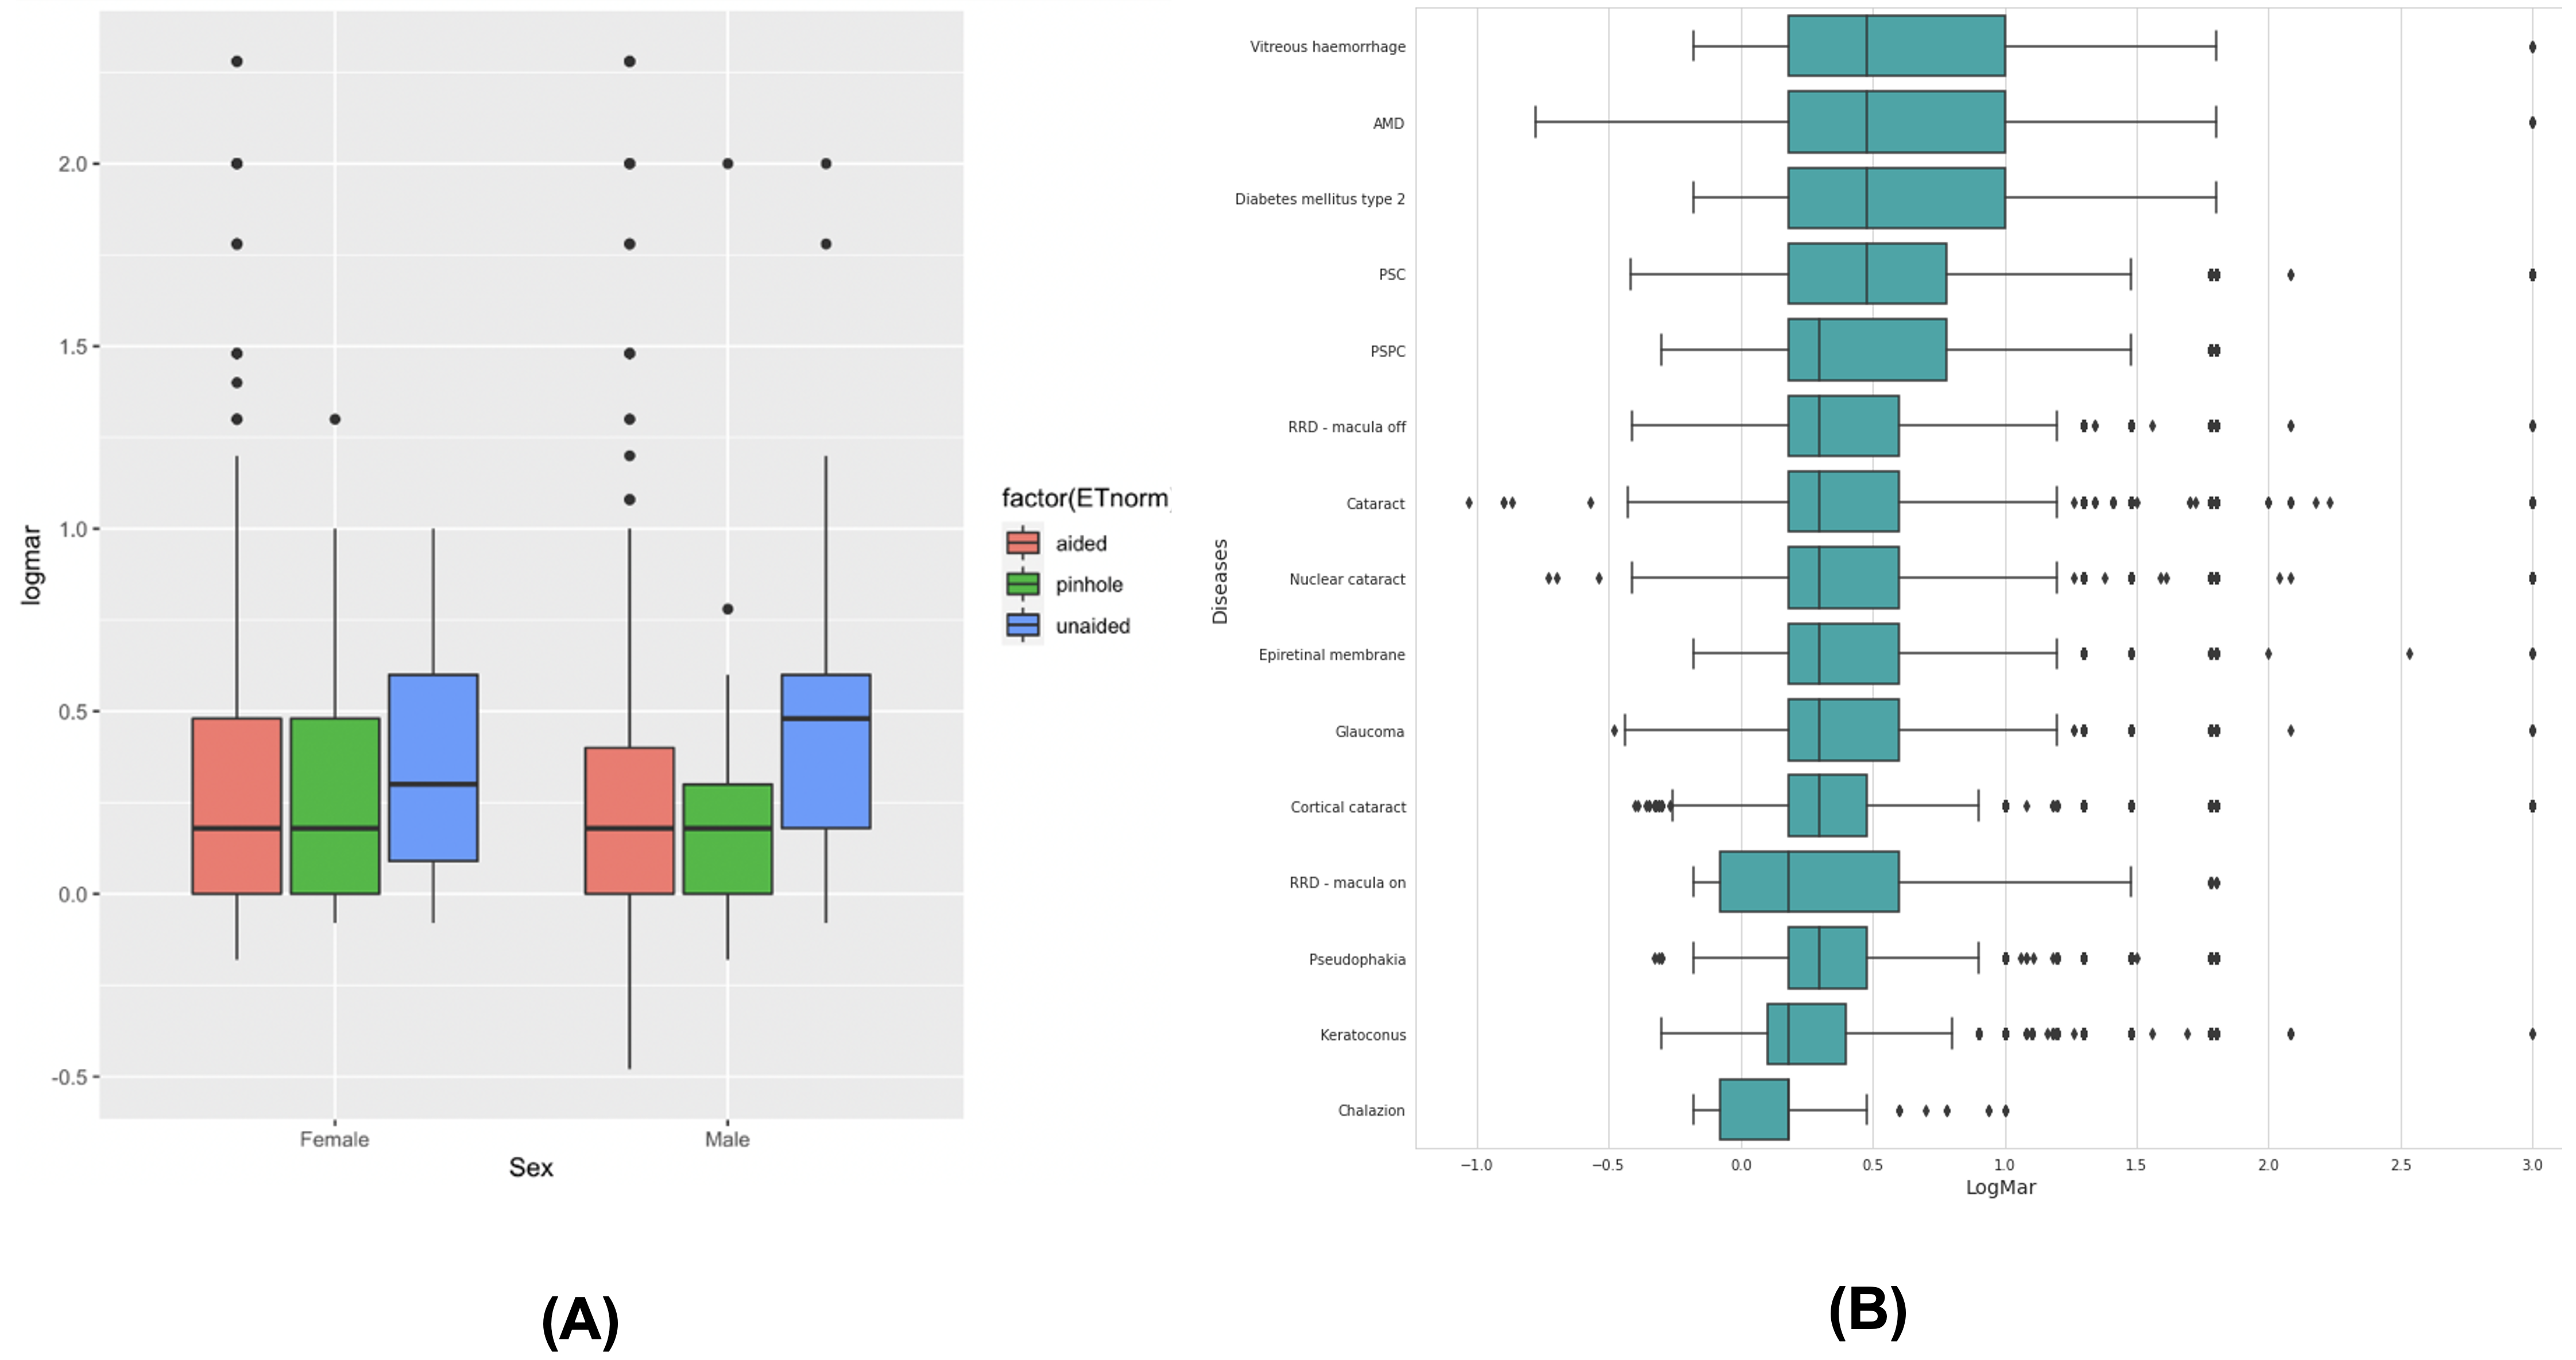
Disease-level VA profiles. Sorting 15 of the most common diagnoses by median extracted VA reveals an expected but now automatically quantifiable clinical gradient: post-operative states (macula-on retinal detachment repair, pseudophakia) cluster at the favorable end, while vitreous hemorrhage, AMD, diabetic retinopathy, and posterior subcapsular cataract sit at the worse end. Figure 9 shows the full breakdown by disease and correction type.
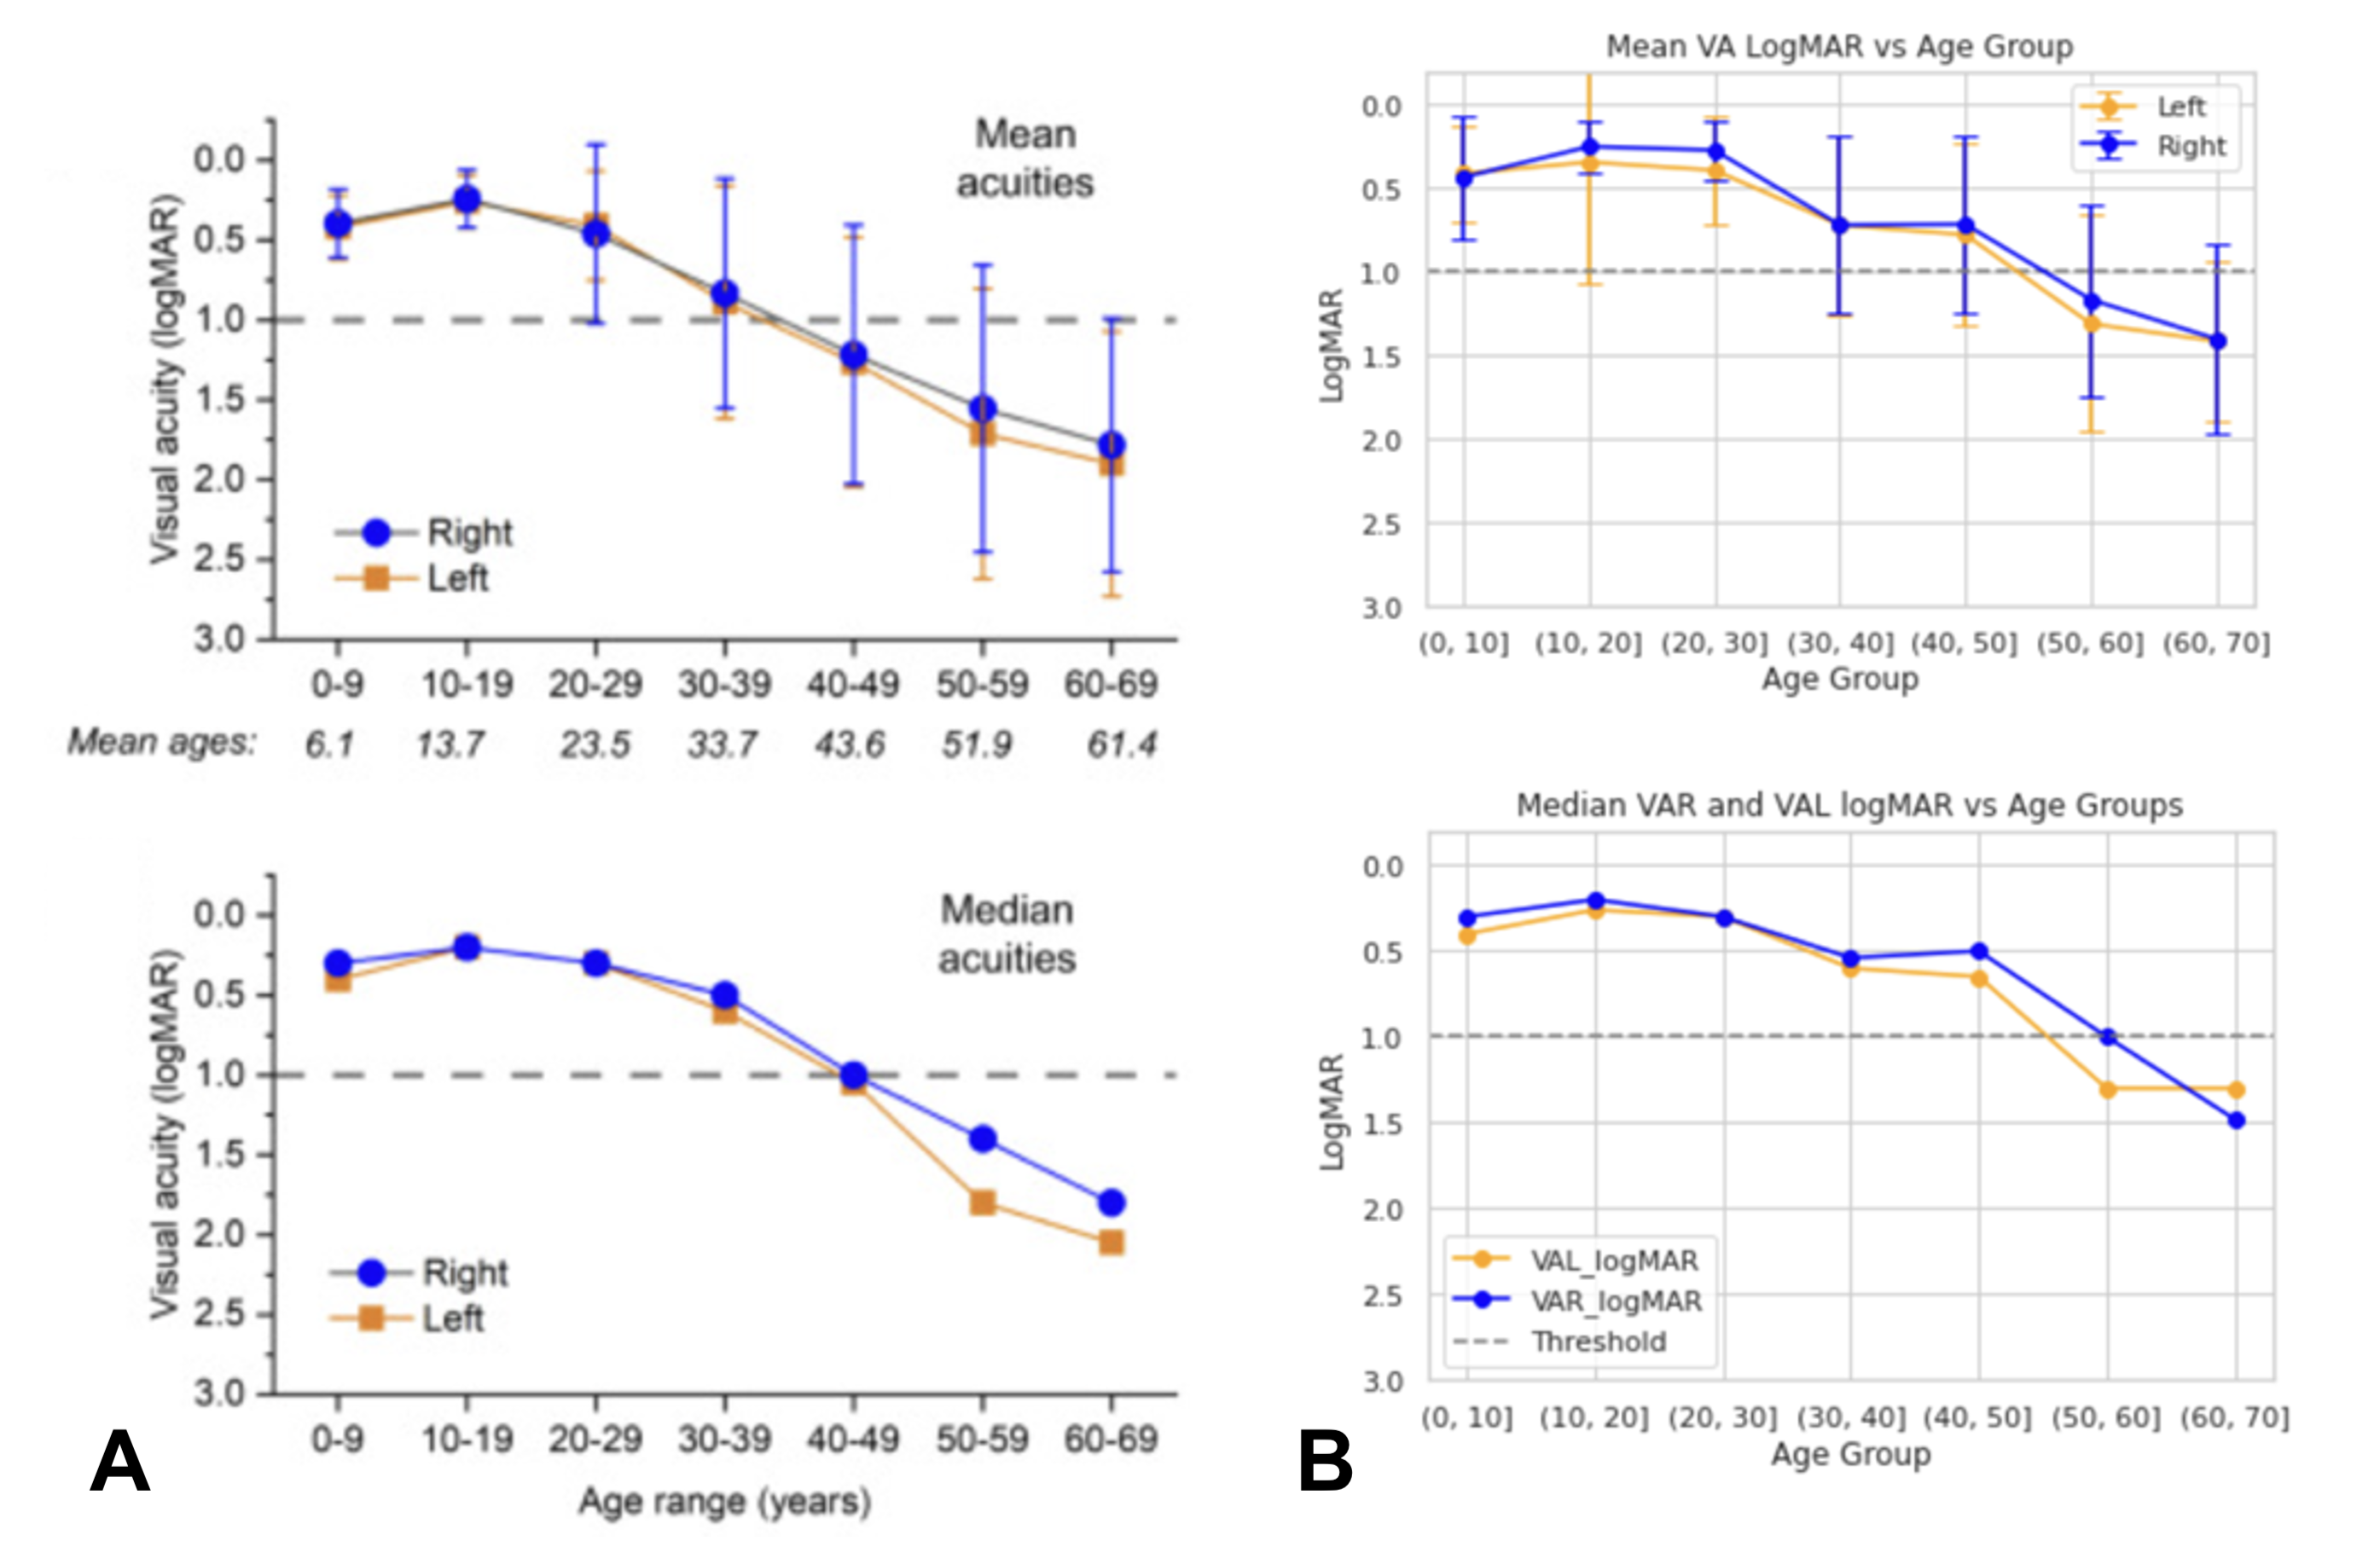
Replicating a natural history study. As a validation of research-grade utility, VABERT was used to replicate the VA trajectory from a published natural history study of RPGR-associated retinitis pigmentosa (De Silva et al., 2023). Without any manual curation, the extracted data reproduced the same age-related decline pattern reported in the original study. Figure 10 shows the comparison. The slight divergence in patients over 40 reflects temporal noise from historical VA mentions in letters rather than true pipeline error, a known limitation of note-level extraction without explicit temporal reasoning.
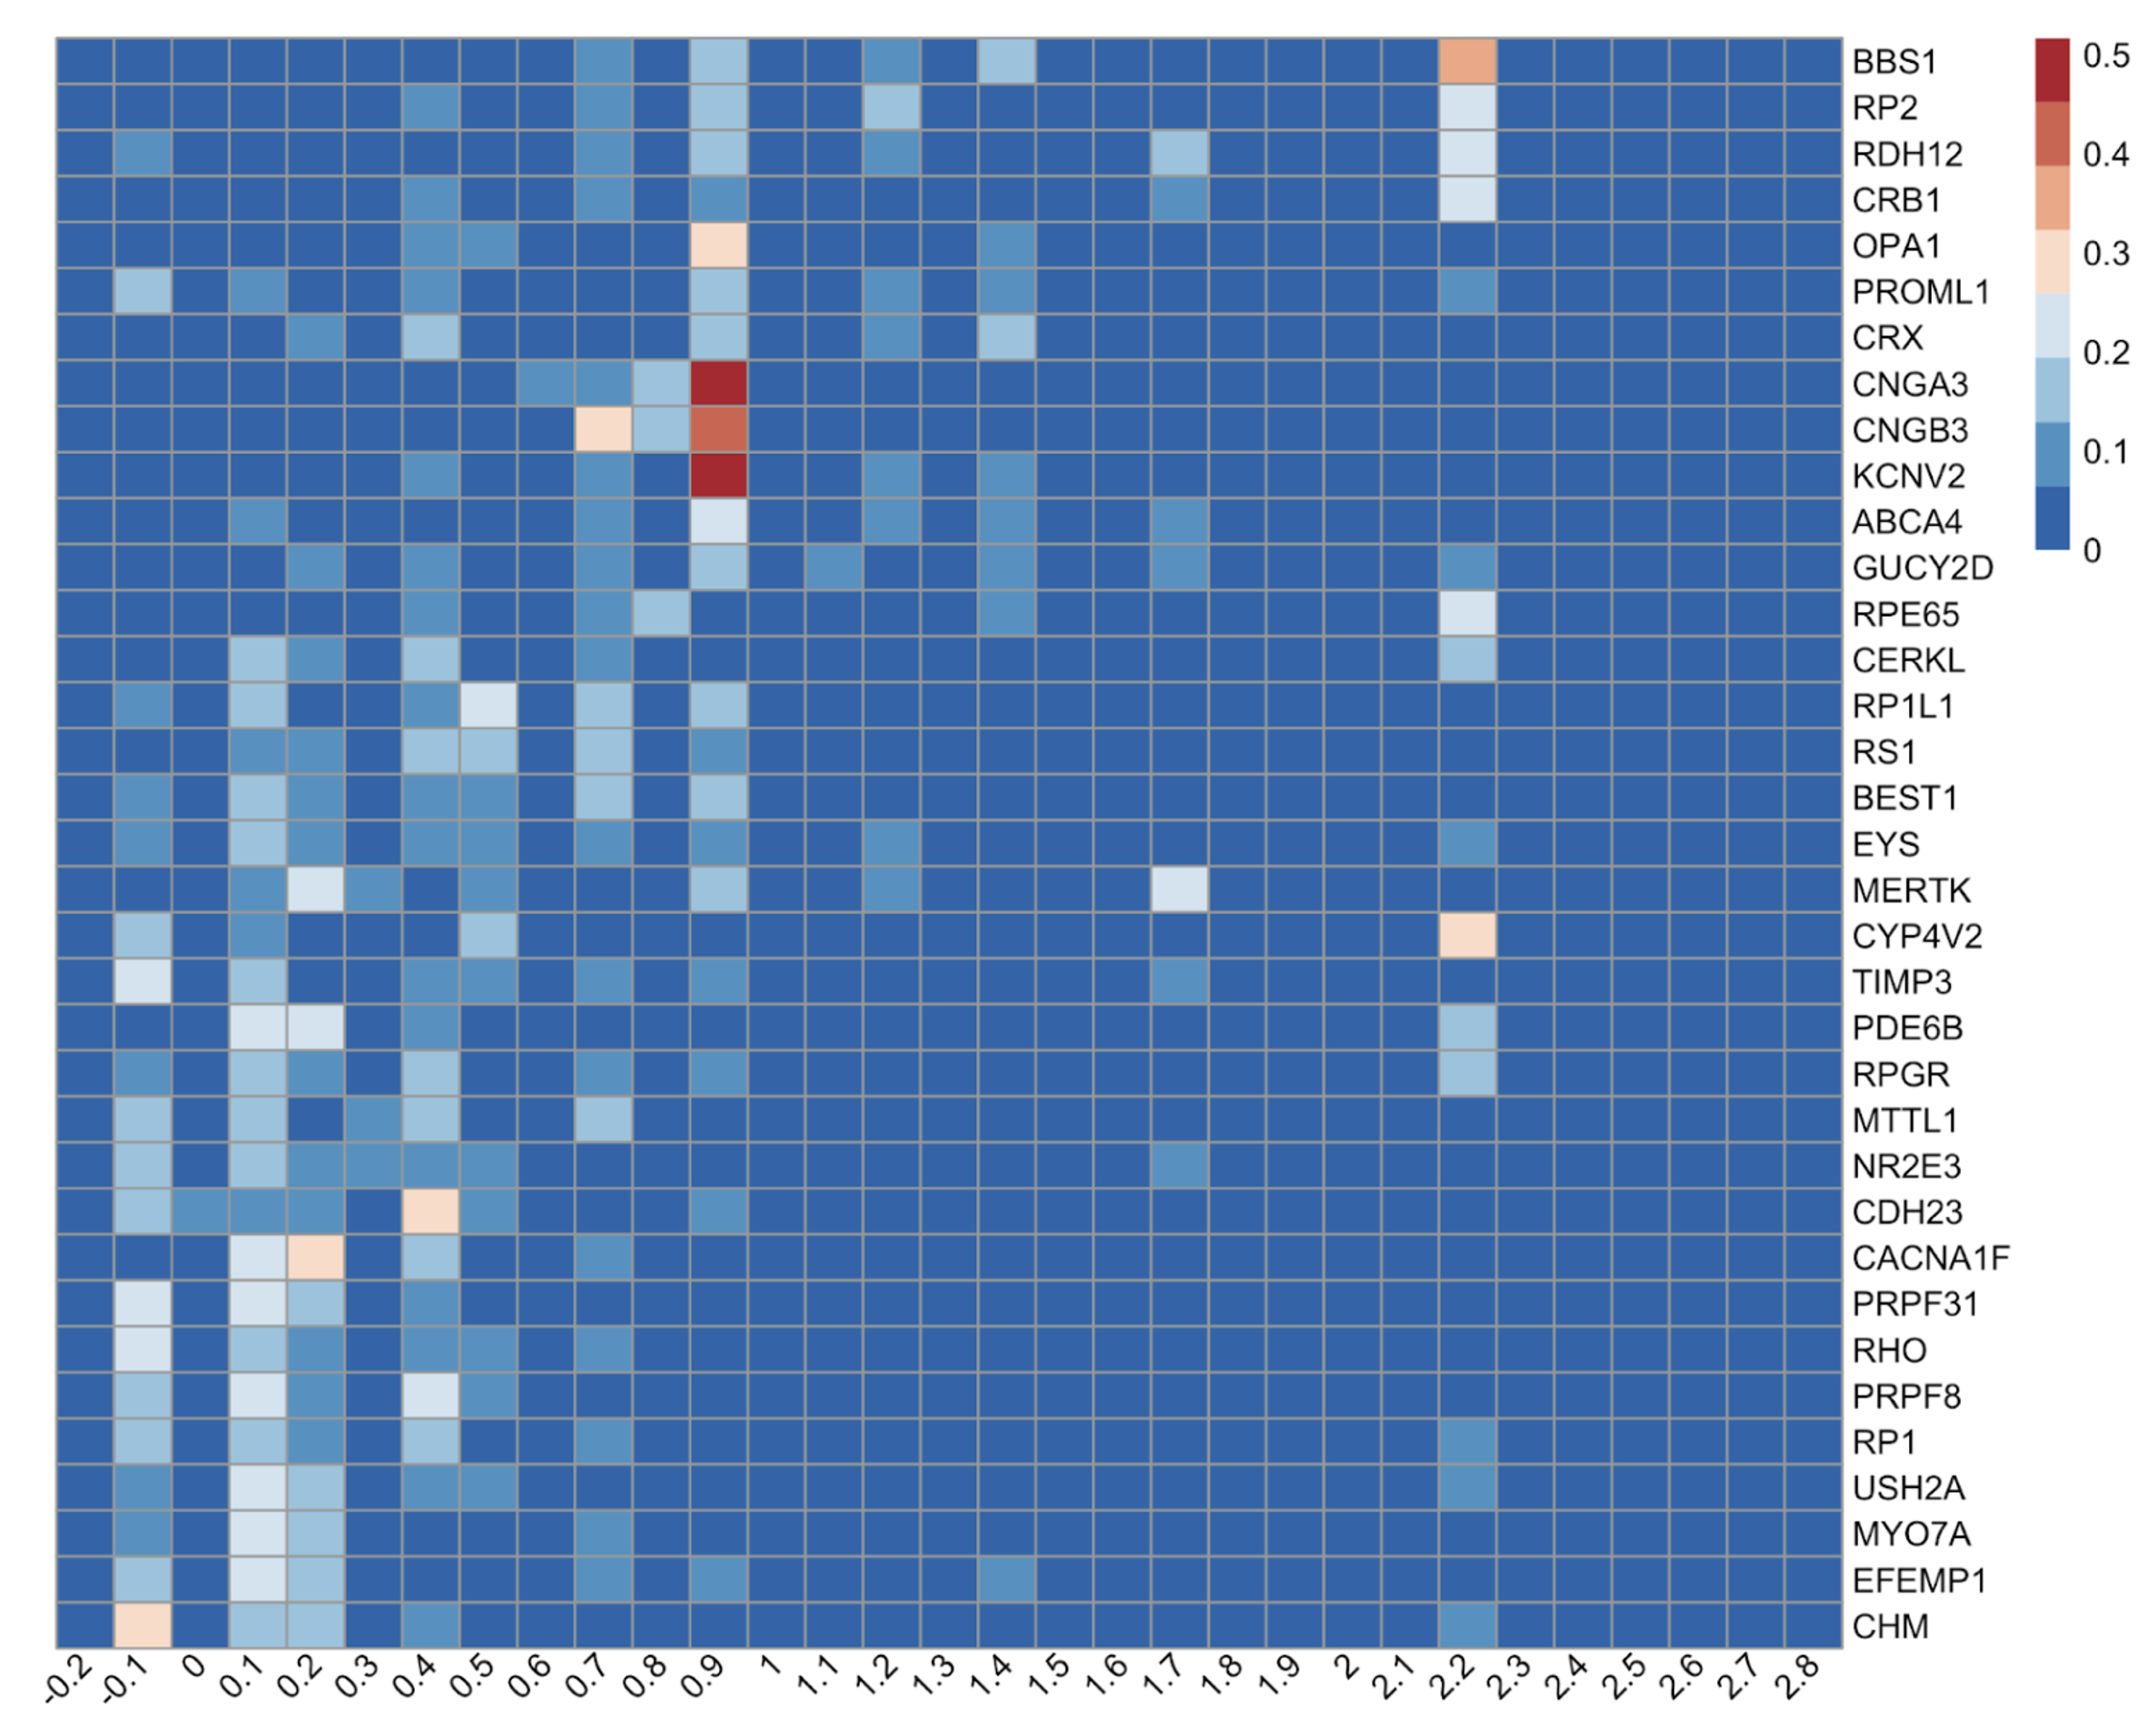
Genotype-specific visual phenotypes at scale. The most compelling application is the Eye2Gene project, which uses extracted VA from 26,049 measurements across 2,570 patients with inherited retinal disease (IRD), spanning 36 disease genes. The heatmap in Figure 11 reveals three biologically distinct phenotypic clusters that emerge cleanly from the extracted data alone.
- Vision-preserving genotypes (CHM, EFEMP1, RHO): distributions concentrated at LogMAR ≤ 0.3, indicating retained central vision despite peripheral degeneration.
- Visual ceiling genotypes (CNGA3, CNGB3, KCNV2, cone dystrophies and achromatopsia): tight, kurtotic distributions around LogMAR 0.7-1.0, reflecting a stationary cone dysfunction phenotype where patients have stable but permanently limited acuity.
- Severe progression genotypes (BBS1, RP2, RDH12): right-skewed distributions extending toward HM and LP, with discrete vertical bands at LogMAR 2.28 and 2.7 marking the encoded semi-qualitative descriptors, indicating frequent progression beyond measurable Snellen range.
These clusters align precisely with known clinical genetics, validating that the pipeline recovers biologically meaningful signal from free text at a scale that would take years to collect manually.
The practical upshot is straightforward: a pipeline that achieves ~83% end-to-end accuracy on a held-out cohort, when applied at the scale of millions of letters, produces a phenotypic database rich enough to replicate published natural history studies and recover genotype-specific disease signatures, all without a single manual annotation beyond the initial model training.
Federated Learning or LLM?
In late 2024, I had the opportunity to collaborate with Dr. Sophia Wang at the Byers Eye Institute, where I gained access to a VA dataset from Stanford, similar in spirit to the MEH corpus but distinctly different in letter length, documentation style, clinical complexity, and patient population. Access to two such distinct datasets from separate clinical settings on separate continents is rare, and since Dr. Sophia’s lab had already done prior work on VA extraction (Bernstein et al., 2024), this felt like a natural moment to ask a harder question: can we find a single model that generalises well across both sites?
The key constraint is that the two datasets cannot be pooled in one place due to data privacy requirements. Two approaches present themselves: federated learning (McMahan et al., 2017), where a BERT model is trained jointly using data from both sites without ever centralising it, or a large language model pre-trained on a massive and diverse corpus, which may generalise across clinical settings without any site-specific adaptation. The full study has been published.
Datasets
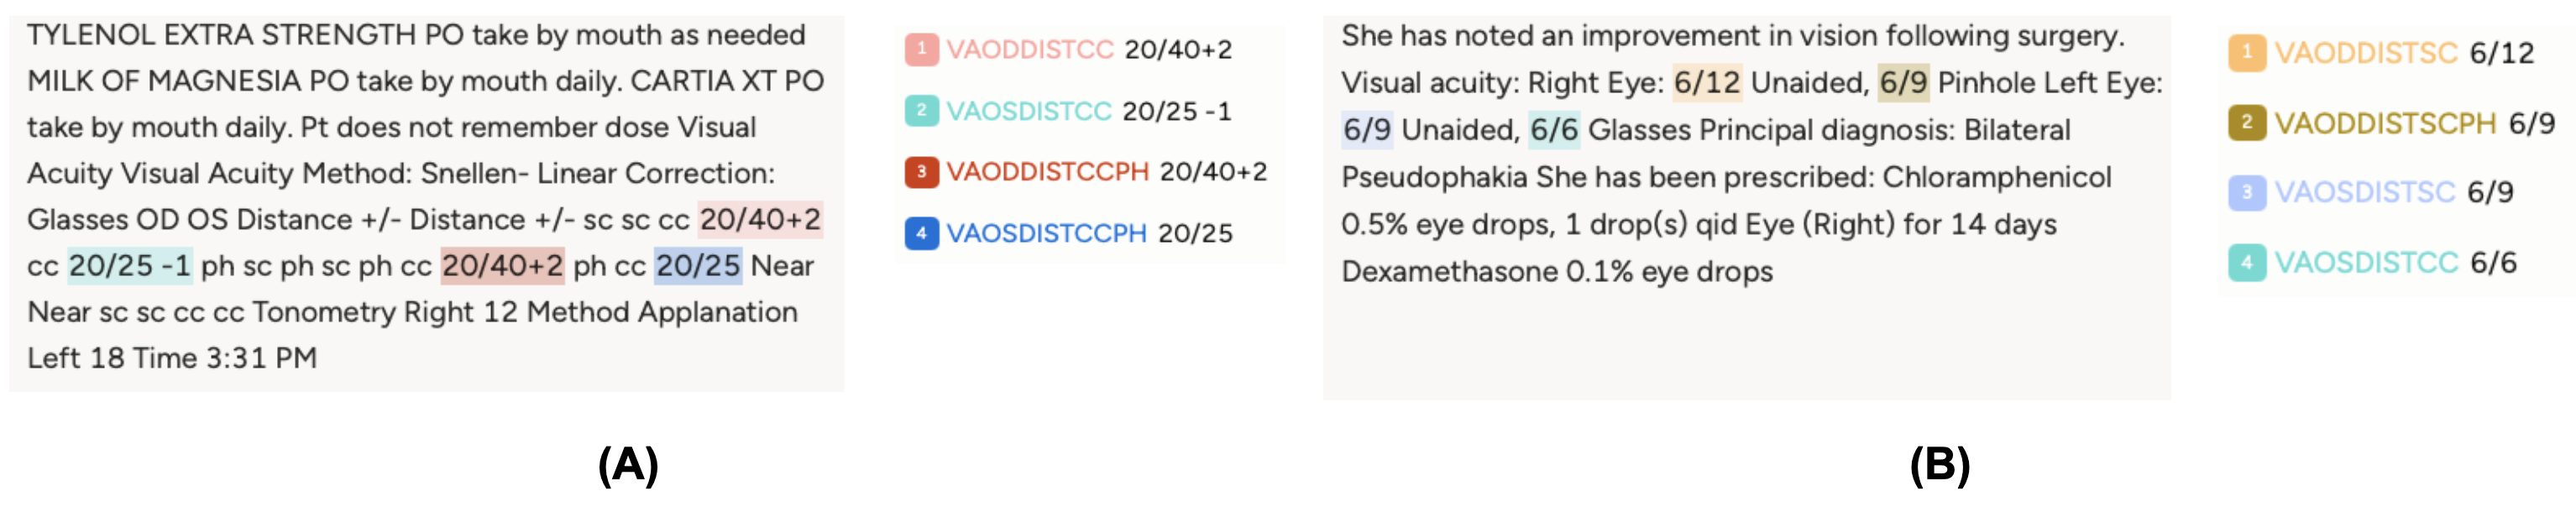
The Stanford corpus consists of 319,756 clinical notes from ~90,000 patients, with VA annotations generated in a weakly supervised manner from semi-structured EHR fields. The MEH corpus is far smaller, 254 training and 98 test notes, with all VA entities manually annotated. The two corpora look nothing alike: Stanford notes are produced using EHR-formatting templates and follow a machine-readable, highly consistent layout, while MEH notes are written entirely by clinicians in natural free text, with implicit conventions that require clinical knowledge to parse correctly (for example, the first VA appearing in the note is assumed to be the right eye). Figure 12 illustrates this contrast.
Results
Table 3 summarizes the micro-averaged strict F1 across all models and evaluation settings; Figure 13 traces the F1 trajectory across 500 federated communication rounds.
| Model | Stanford F1strict | MEH F1strict |
|---|---|---|
| Baseline (home site) | 0.943 | 0.427 |
| Cross-evaluation (other site) | 0.204 | 0.502 |
| FedAvg | 0.942 | 0.544 |
| STWT | 0.940 | 0.519 |
| LLaMA-3-70B (Dubey & others, 2024) | 0.375 | 0.660 |
| Mixtral-8x7B (Jiang et al., 2024) | 0.288 | 0.423 |
The generalization gap is real and severe. Cross-site evaluation reveals a dramatic performance collapse: the Stanford-trained model dropped from F1_strict=0.943 at home to 0.502 on MEH. The reverse was even worse, reaching only 0.204 on Stanford, because MEH’s implicit free-text conventions are largely illegible to a model trained exclusively on templated notes.
Federated learning bridges the gap without touching the data. Both FL algorithms substantially recovered this loss. FedAvg reached F1_strict=0.544 on MEH while maintaining 0.942 on Stanford. STWT achieved comparable strict scores (0.519 MEH, 0.940 Stanford) and outperformed FedAvg on partial matching (0.844 vs. 0.814 on MEH), with markedly more stable convergence throughout training, as seen in Figure 13. The noisy F1 curve of FedAvg across rounds contrasts sharply with STWT’s smooth progression, a meaningful practical advantage when you cannot afford to run for hundreds of rounds to find the best checkpoint.
LLMs are note-structure dependent. LLaMA-3-70B (Dubey & others, 2024) excelled on MEH’s natural free text (F1_strict=0.660), easily outperforming all BERT-based models with just five in-context examples. But it collapsed on Stanford’s templated notes (F1_strict=0.375). Mixtral-8x7B (Jiang et al., 2024) fared similarly. This reveals a nuanced point: LLMs handle linguistic variation and implicit clinical conventions well, but the rigid machine-generated patterns in templated notes are precisely what discriminative BERT models learn to exploit. Neither paradigm dominates both environments.
The takeaway is clear: when clinical note styles differ substantially across institutions, no single model generalises for free. FL, particularly STWT, offers a principled path to cross-institutional performance without centralising sensitive data, and is most valuable precisely in the settings where naive cross-evaluation fails the hardest.
Toward scalable and general-purpose ophthalmic information extraction
The previous chapters demonstrated that fine-tuned BERT models can achieve strong performance on specific, well-defined extraction tasks, but each one required a custom annotated dataset. This is a bottleneck. In practice, clinical teams generate dozens of different extraction requests, each with its own schema, subspecialty, and note style. Annotating a training set for every new task is not feasible. Generative large language models offer a different path: define the task in a prompt, and the model extracts the information directly, with no fine-tuning required. The question is whether this actually works in ophthalmology, across tasks of varying complexity and clinical domains.
To answer this, I assembled the Ophthalmic Language Understanding Benchmark (OLUB), a heterogeneous corpus of ten real-world datasets collected through collaborations with clinicians at MEH and the Byers Eye Institute between January 2024 and September 2025. Each dataset originated from a genuine clinical audit or research project, covering subspecialties including glaucoma, strabismus, cataract, cornea, genetics, and uveitis. The tasks span two types: patient identification (given a patient’s aggregated notes, determine whether they meet a clinical criterion) and clinical variable extraction (extract structured data such as VA measurements, laterality, or treatment outcomes from individual notes). Document lengths vary by more than two orders of magnitude, from short single-visit notes (median ~130 tokens) to longitudinally aggregated patient records exceeding 88,000 words.
Models and setup
Seven models were evaluated across a parameter range from 8B to 70B:
- Generalist models: LLaMA-3.1-8B (Dubey & others, 2024), Gemma-2-9B/27B (Gemma Team et al., 2024), GPT-OSS-20B (OpenAI, 2025), Mixtral-8x7B (Jiang et al., 2024), LLaMA-3.3-70B (Dubey & others, 2024)
- Ophthalmology-specialized: LEME-DPO 70B (Gilson et al., 2024), trained on ~211K ophthalmology-specific instruction samples and aligned using Direct Preference Optimization
All models ran locally on hospital-grade hardware (8×NVIDIA P100 at MEH; 2×A100 at Stanford) using 4-bit quantization. Prompts followed a standardized three-part structure: task definition, optional notation for clinical abbreviations, and a strict JSON output specification enforced by an automatic retry mechanism (up to 5 attempts per sample).
Results
Table 4 summarizes performance across all models and datasets.
| # | Dataset | 8B | Gemma 9B | GPT-OSS 20B | Gemma 27B | Mixtral 8x7B | LLaMA 70B | LEME 70B |
|---|---|---|---|---|---|---|---|---|
| 1 | GDD-Botox | 0.061 | 0.780 | 0.922 | 0.720 | 0.711 | 0.909 | 0.770 |
| 2 | IR-Botox | 0.022 | 0.680 | 0.912 | 0.696 | 0.212 | 0.622 | 0.338 |
| 3 | Cong. Esotropia | 0.984 | 0.423 | 0.989 | 0.027 | 0.907 | 0.986 | 0.995 |
| 4 | YAG Cap | 0.711 | 0.678 | 0.829 | 0.815 | 0.738 | 0.868 | 0.843 |
| 5 | RP-CMO | 0.630 | 0.770 | 0.660 | 0.650 | 0.710 | 0.630 | 0.640 |
| 6 | PED-Postop | 0.721 | 0.860 | 0.870 | 0.873 | 0.851 | 0.893 | 0.845 |
| 7 | VA-RPGR | 0.900 | 0.951 | 0.968 | 0.939 | 0.924 | 0.970 | 0.950 |
| 8 | FECD-SRGR | 0.810 | 0.815 | 0.807 | 0.818 | 0.282 | 0.824 | 0.750 |
| 9 | Byers-VA | 0.634 | 0.537 | 0.867 | 0.655 | 0.678 | 0.757 | 0.711 |
| 10 | Byers-CAAMPUS | 0.449 | 0.412 | 0.626 | 0.559 | 0.535 | 0.596 | 0.451 |
| Mean | 0.592 | 0.691 | 0.845 | 0.675 | 0.655 | 0.806 | 0.729 |
Parameter count alone does not determine performance. GPT-OSS-20B achieved the highest mean score (0.845) despite being less than a third of the size of the 70B models. It ranked first on 6 of 10 tasks and was the only model to break 0.9 on three different datasets. LLaMA-3.3-70B came second (0.806), while LEME-DPO, the ophthalmology-specialized 70B model, scored only 0.729, below even Gemma-2-9B (0.691). Alignment quality and instruction-following ability, not domain-specific pretraining, appear to be the dominant factors for structured extraction tasks.
Task difficulty matters more than model size. Simple patient identification tasks with short, well-structured notes (GDD-Botox, IR-Botox, Congenital Esotropia) were easy for capable models and near-impossible for small or poorly aligned ones. Long aggregated documents (Byers-CAAMPUS: median 8,282 tokens, max 88,858) degraded all models, including GPT-OSS-20B whose best score there was only 0.626. This ceiling is a fundamental challenge for LLMs on longitudinal clinical records.
Performance vs. efficiency
Figure 14 shows the clear performance-efficiency trade-off. Smaller models are fast but mediocre. The largest models improve accuracy but at rapidly increasing latency, with LLaMA-3.3-70B averaging 17.03 seconds per data point compared to 4.14 seconds for GPT-OSS-20B, for a gain of only 0.039 in mean score. For any pipeline processing thousands of clinical letters, this cost is rarely justifiable.
Reliability of structured output
Beyond accuracy and speed, a critical practical concern is whether models consistently produce parseable JSON, a prerequisite for automated downstream processing. As shown in Figure 15, first-attempt success rates vary widely and do not correlate with model size. GPT-OSS-20B achieved 99.17% valid JSON on the first attempt; Gemma-2-27B reached 99.04%. In contrast, LEME-DPO produced valid JSON on the first attempt only 76.66% of the time, the worst of all models, despite being domain-specialized. Mixtral-8x7B (83.87%) and LLaMA-3.1-8B (87.55%) also showed high failure rates. Domain-specific fine-tuning appears to trade structural discipline for semantic richness, a trade-off that is expensive in any automated pipeline.
The overall picture from this work is encouraging but realistic. LLMs, particularly well-aligned intermediate-scale models like GPT-OSS-20B, can meaningfully support real clinical extraction workflows in ophthalmology without any task-specific annotation, making them genuinely useful for new, low-resource extraction tasks. However, long aggregated documents remain a hard problem, reliability varies substantially across models in ways that are not predictable from scale, and inference latency at the 70B tier remains a bottleneck for large-scale deployment. The most viable path forward is probably a hybrid one: use LLMs to generate training data or handle rare tasks, and reserve encoder-based models for high-throughput, well-defined extractions where fine-tuning is feasible.
Conclusion
Looking back across these chapters, a few threads run through everything.
The first is about data. A third of all visual acuity measurements at the largest specialist eye hospital in the UK exist only in free text, inaccessible to any structured query. For rarer variables, older records, or subspecialties that have not yet adopted templated data entry, the fraction locked in narrative is higher still. The premise of this work is simple: clinical NLP can unlock that data at scale, and the payoff, in terms of retrospective research, cohort discovery, and phenotypic characterization, is large enough to justify the effort.
The second thread is about what kind of model to use, and when. BERT-based models, when fine-tuned on even modest amounts of annotated data, are highly competitive and offer speed, reliability, and interpretability that matter in deployment. Pre-training on domain-specific text (EyeBERT) did not consistently outperform strong foundation models like PubMedBERT, suggesting that the volume and diversity of pre-training data matter more than domain overlap alone. For the VA extraction task specifically, a fine-tuned BioBERT model achieved 97% NER micro-F1 and recovered 2.4 million VA records from 5.8 million clinical letters, enabling analyses that would have taken years to replicate manually. For generalization across institutions with different documentation styles, federated learning, particularly STWT, proved a practical and privacy-preserving path, recovering most of the performance lost in naive cross-site transfer without pooling a single record.
The third thread is about the emerging role of LLMs. For new extraction tasks where annotation is expensive, generative LLMs with prompt-based interfaces offer genuine value: no retraining, no annotated dataset, and reasonable accuracy across diverse clinical tasks. The OLUB results show that well-aligned models at the 20B scale can match or exceed specialized 70B models on structured extraction, and that the bottleneck is usually task formulation and document length, not model size. At the same time, the failure modes, unreliable JSON output, degradation on long aggregated records, high inference cost, mean that LLMs are better positioned as a complement to rather than a replacement for encoder-based extraction at scale.
The broader ambition behind all of this is a clinical NLP infrastructure for ophthalmology that can be deployed routinely: pulling structured data from letters as they are written, enriching electronic health records retrospectively, and making large-scale phenotypic research from routine care data a realistic proposition rather than a heroic manual effort. Each chapter here is a step in that direction.
References
2025
2024
- Automated Recognition of Visual Acuity Measurements in Ophthalmology Clinical Notes Using Deep LearningOphthalmology Science, 2024
-
-
-
- Language Enhanced Model for Eye (LEME): An open-source ophthalmology-specific large language modelArXiv, 2024
2023
- Visual acuity by decade in 139 males with RPGR-associated retinitis pigmentosaOphthalmology Science, 2023
2021
-
- Domain-Specific Language Model Pretraining for Biomedical Natural Language ProcessingACM Transactions on Computing for Healthcare, 2021
2020
- 2018 n2c2 Shared Task on Adverse Drug Events and Medication Extraction in Electronic Health RecordsJournal of the American Medical Informatics Association, 2020
2019
- BioBERT: a pre-trained biomedical language representation model for biomedical text miningBioinformatics, 2019
-
-
2018
- SemEHR: A General-Purpose Semantic Search System to Surface Semantic Data from Clinical Notes for Tailored Care, Trial Recruitment and Clinical ResearchJournal of the American Medical Informatics Association, 2018
-
2017
- Communication-Efficient Learning of Deep Networks from Decentralized DataProceedings of the 20th International Conference on Artificial Intelligence and Statistics (AISTATS), 2017
2016
2014
- NCBI Disease Corpus: A Resource for Disease Name Recognition and Concept NormalizationJournal of Biomedical Informatics, 2014
2009
- Natural Language Processing with Python2009
1978
- Information Retrieval: Computational and Theoretical Aspects1978