MuDaRI
Multilabel Dataset of Retinal Images for Detection of Multiple Ocular Diseases
This project was presented at the 4th Asia Pacific Tele-Ophthalmology Society (APTOS) Symposium 2019, Chennai, India. [Slides]
This work also received Best Poster Presentation at the Southeast Asia Machine Learning School (SEA MLS) 2019, Jakarta, Indonesia.
Introduction
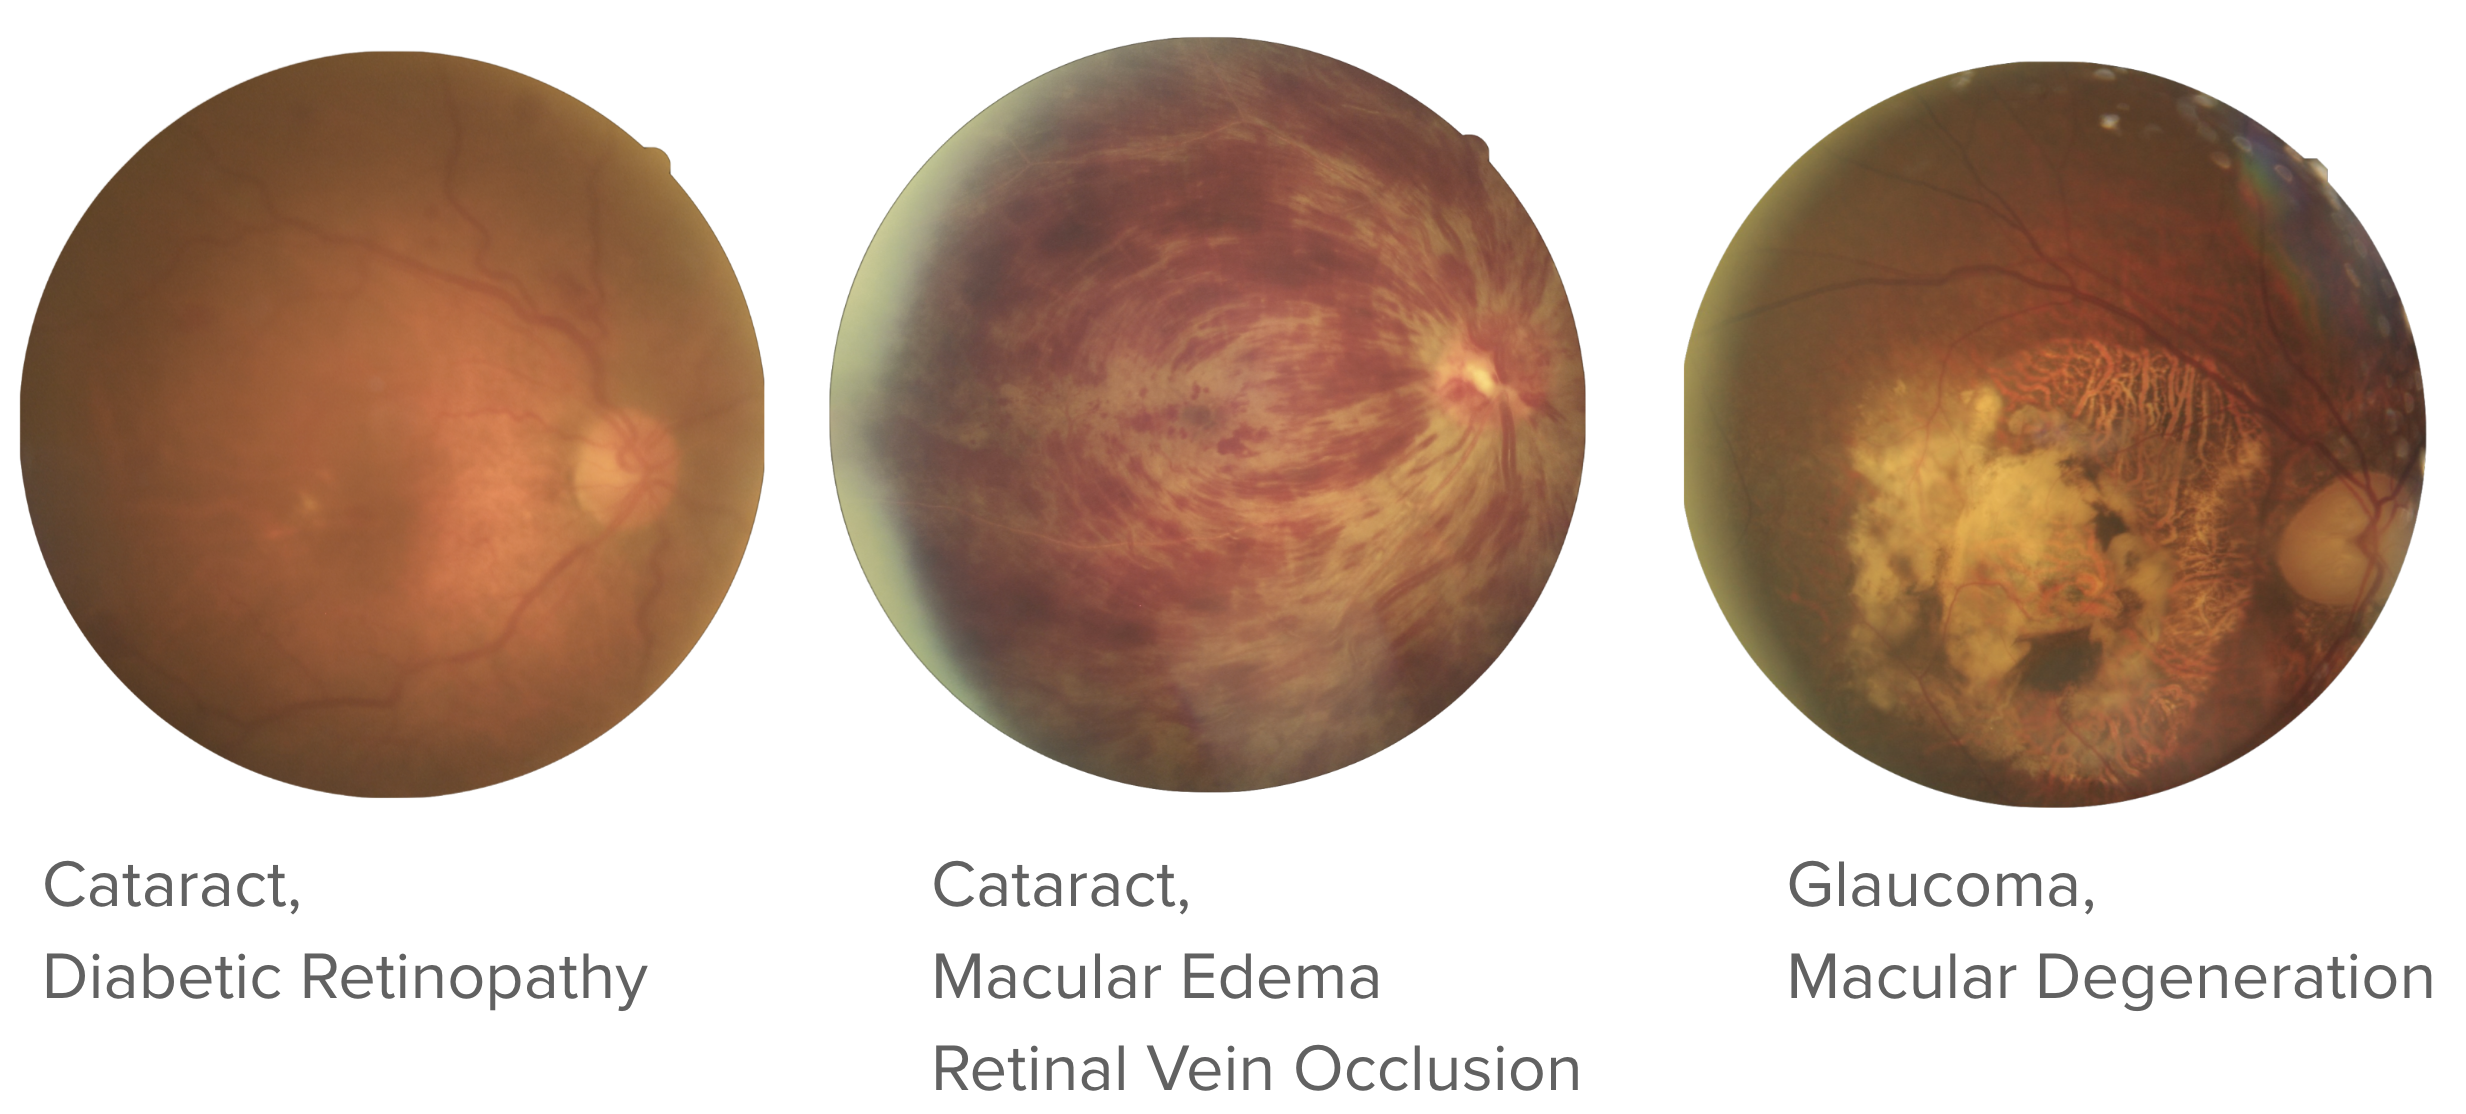
Automated screening of retinal fundus photographs has made significant progress over the past decade, driven largely by the availability of large, well-annotated datasets. However, most publicly available datasets, such as EyePACS (Cuadros & Bresnick, 2009), are organized around a single disease category, meaning each image carries only one diagnostic label, typically for diabetic retinopathy (DR), age-related macular degeneration (AMD), or glaucoma. This single-label paradigm creates a critical gap when deployed in real clinical settings: a model trained exclusively on DR, for instance, can only report whether DR is present or absent, leaving every other concurrent pathology undetected. The clinical consequence is an uncomfortable and potentially misleading outcome where a screening tool reports a patient is clear of one condition while remaining entirely silent about others, as illustrated in Figure 1.
Real patients frequently present with co-occurring conditions: a diabetic patient may simultaneously exhibit DR, macular edema, and early cataract changes within the same fundus image. Addressing this gap requires datasets that are both broader in disease coverage and structured to support multi-label annotation, where a single image can carry several concurrent diagnoses.
In this project, we curate one of the first multilabel datasets of retinal fundus images covering a wide range of ocular diseases, and we develop a multilabel classifier trained on this data to perform simultaneous detection of multiple conditions from a single image.
Building the Dataset
Curation Pipeline
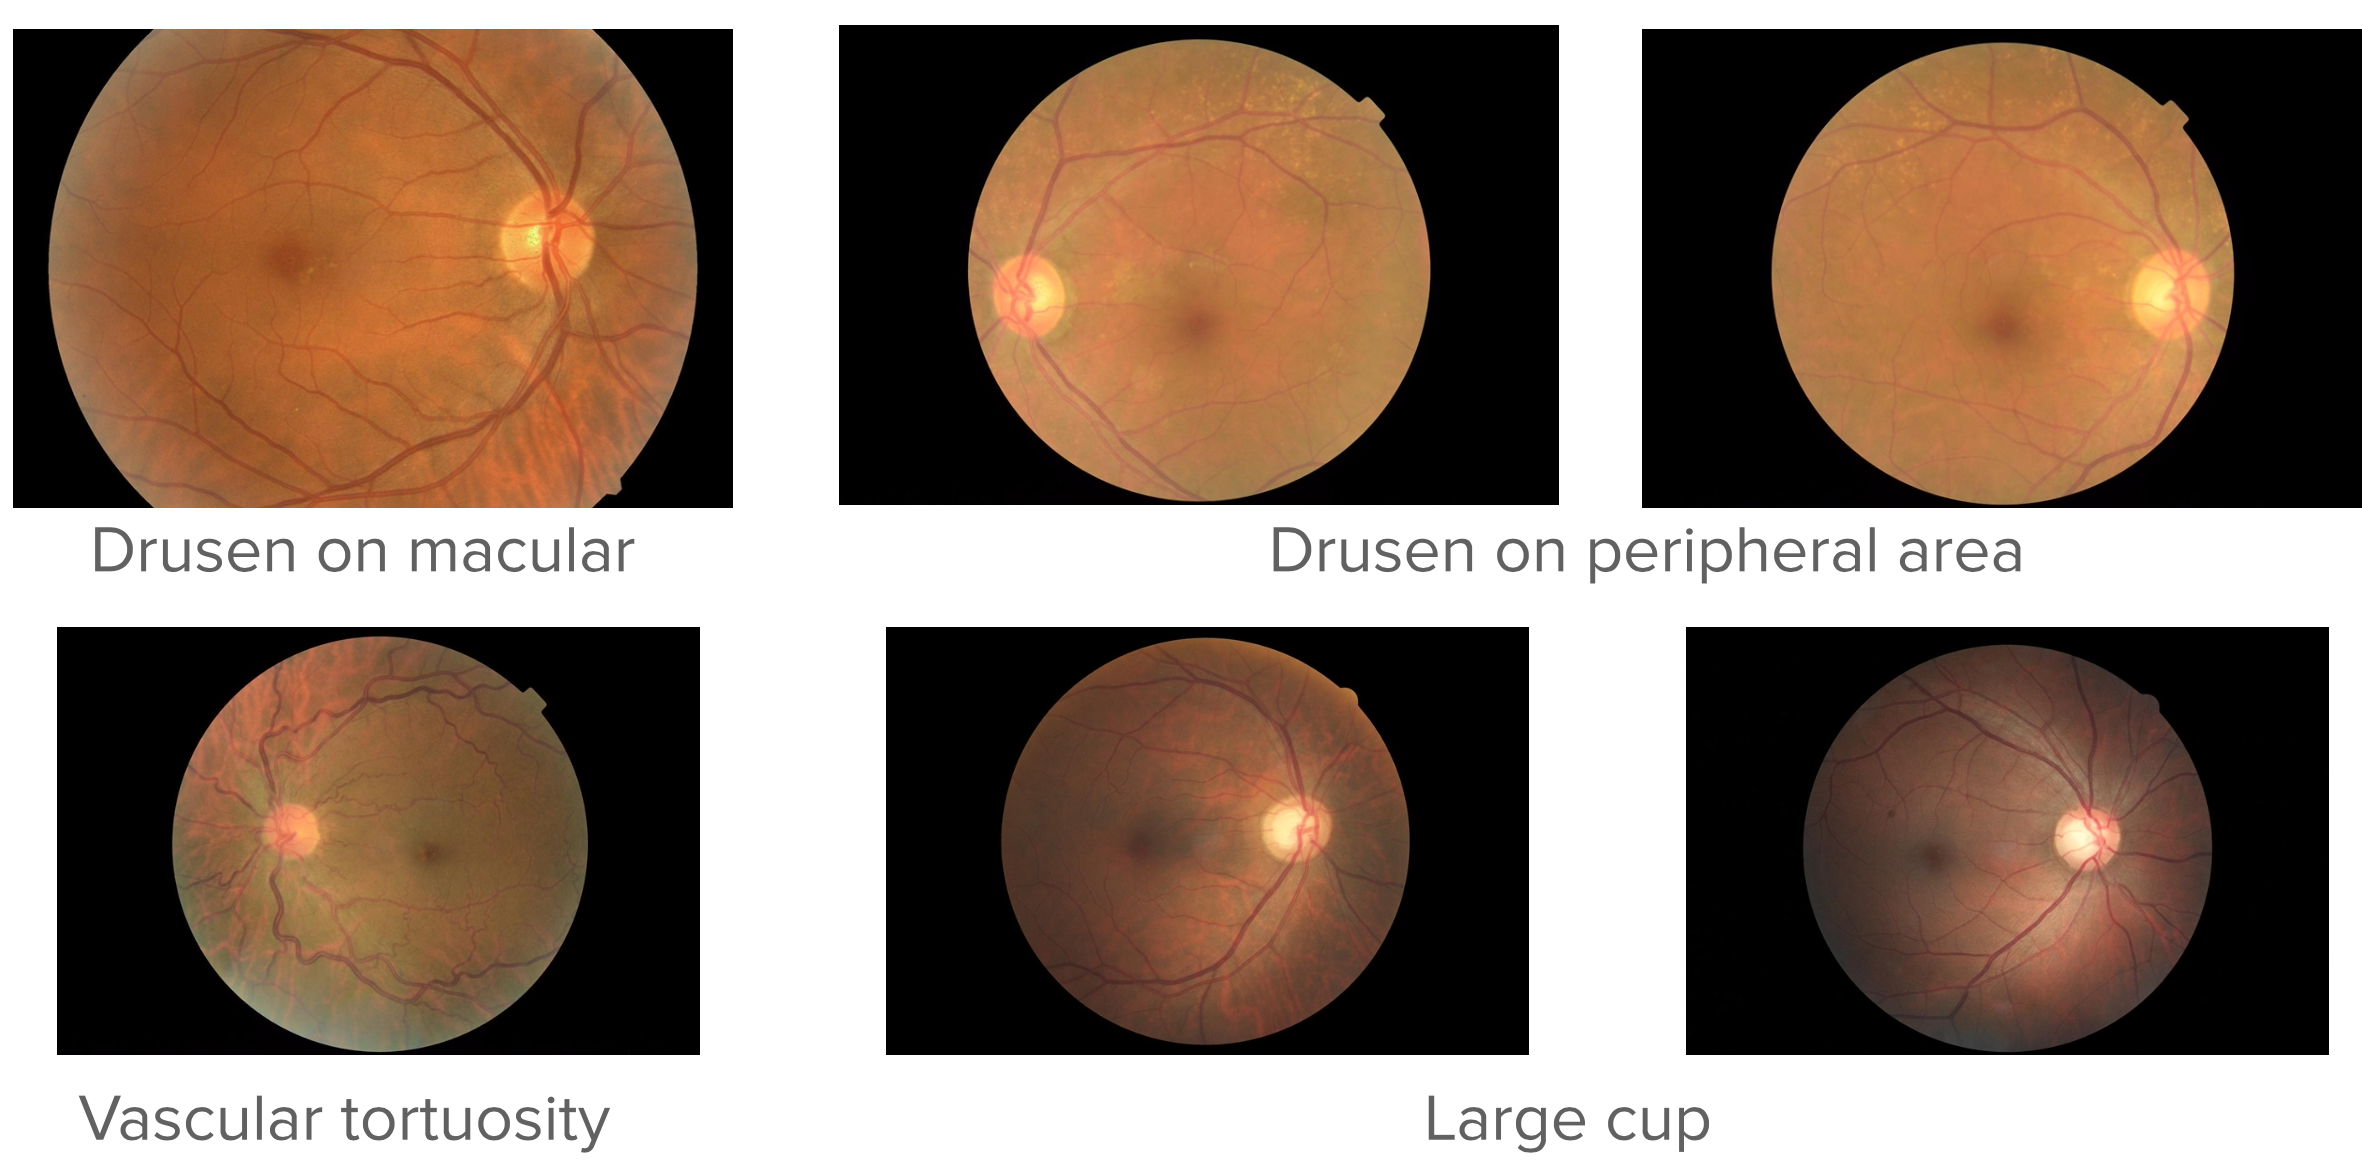
The dataset was sourced from Cao Thang International Eye Hospital (Ho Chi Minh City, Vietnam), a private tertiary eye care center, covering a six-year collection period from 2013 to 2018. A total of 6,871 fundus photographs were retrieved and matched against the corresponding Electronic Medical Records (EMRs). All diagnostic terms were standardized and verified to be in compliance with ICD-10 coding conventions, and the dataset was fully de-identified prior to use.
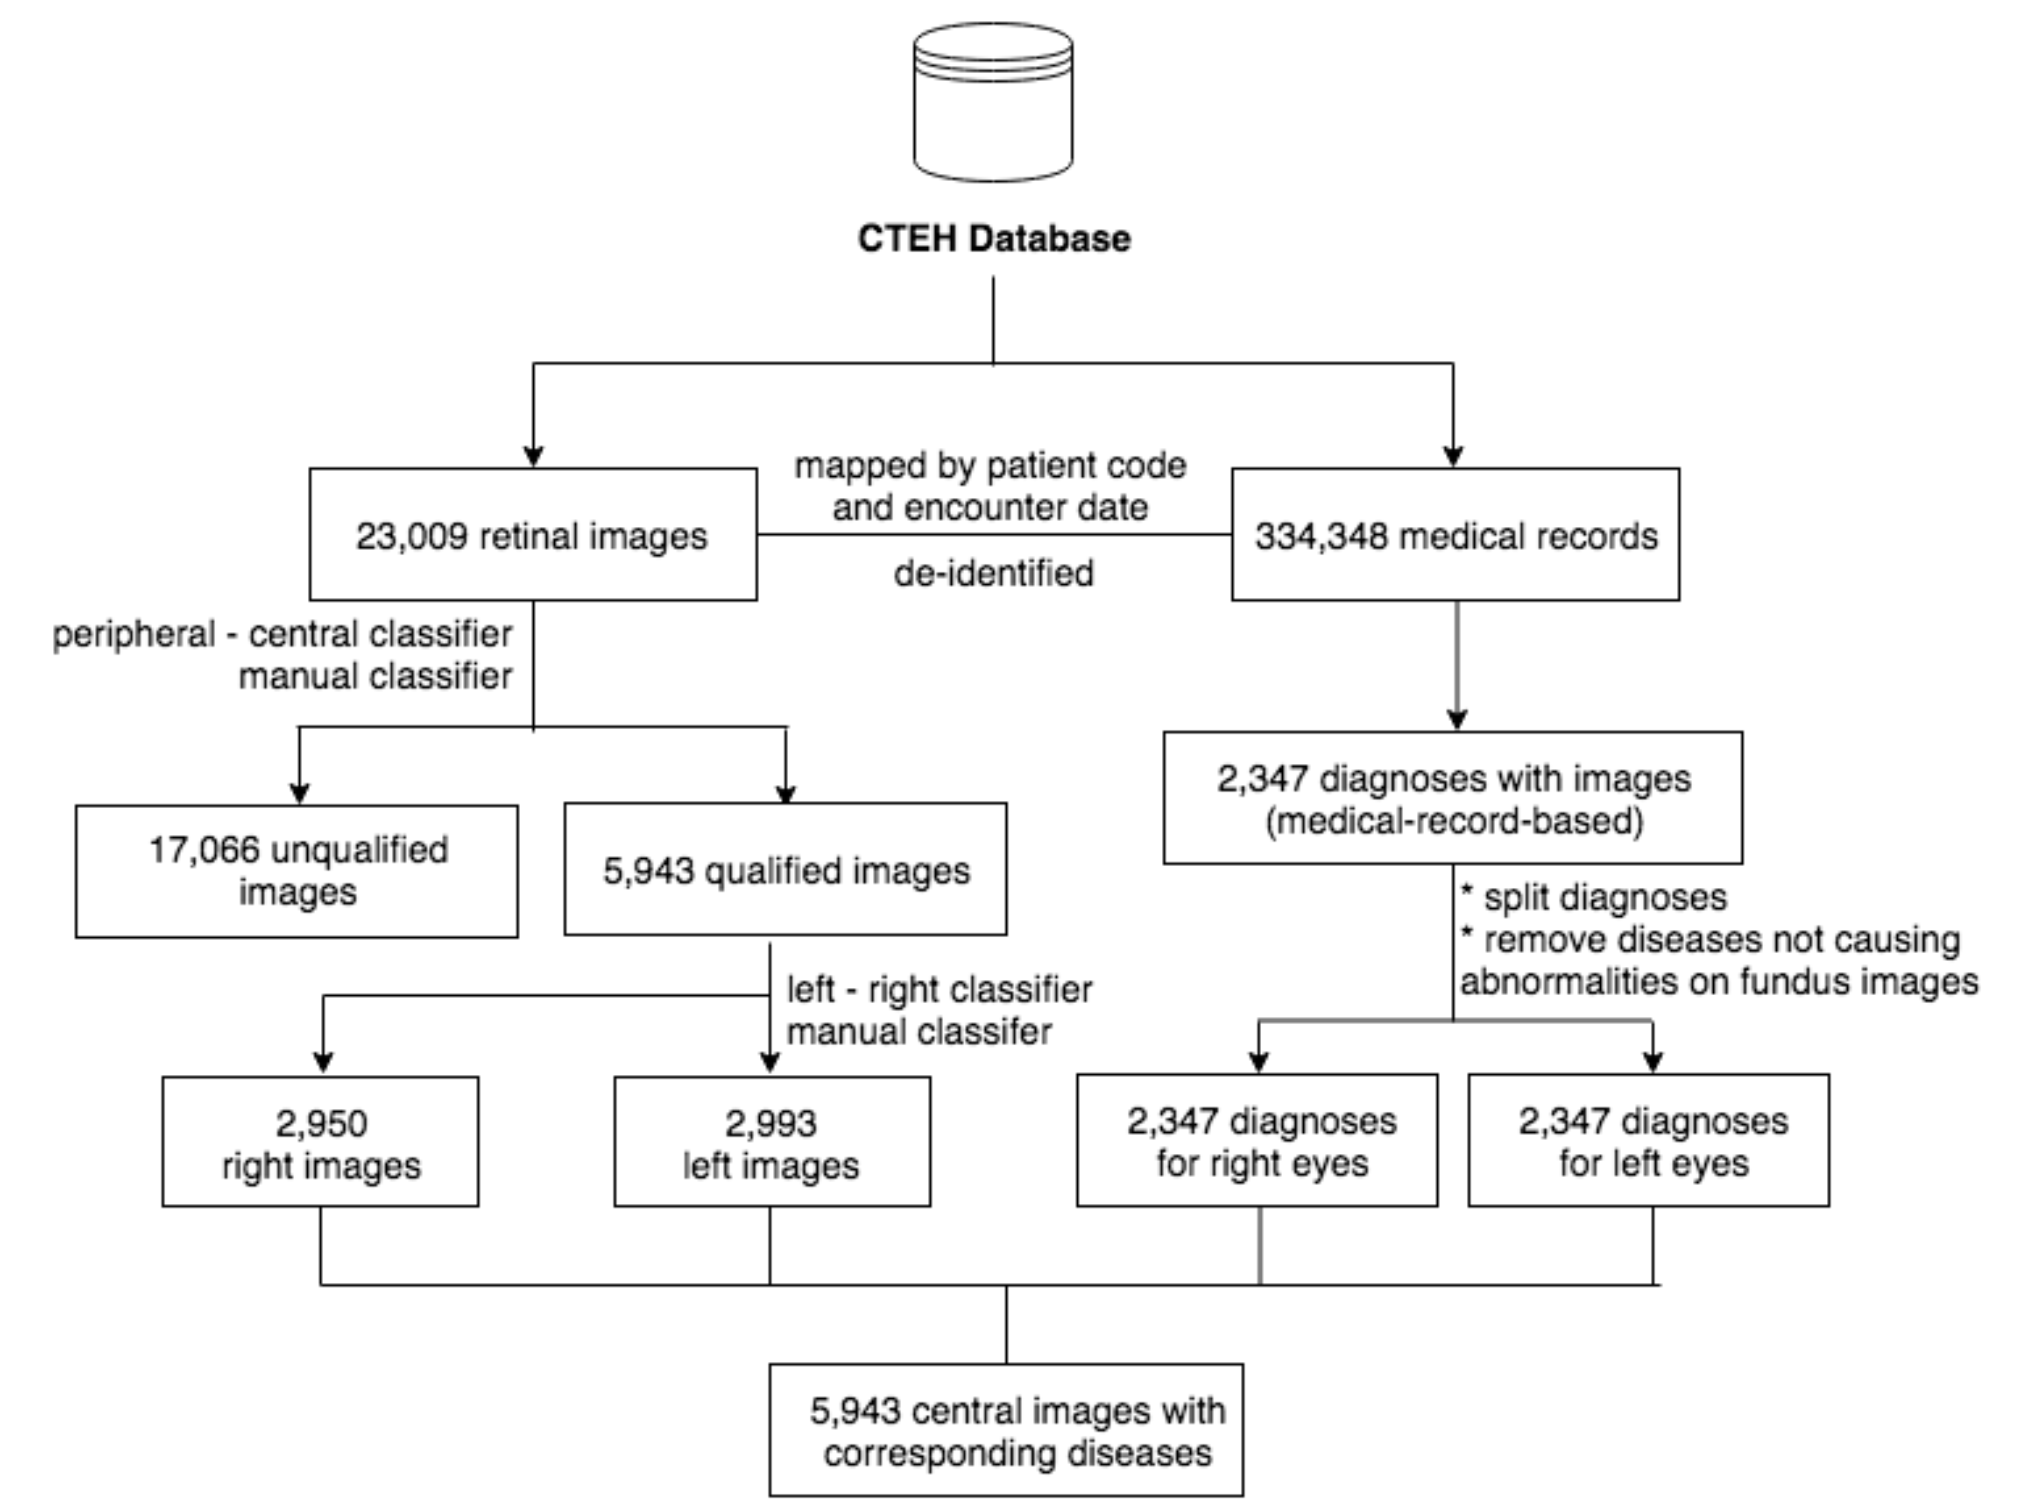
Rather than relying on a purely manual labeling workflow, we integrated convolutional neural network (CNN)-based tools at intermediate stages to assist with image quality filtering and preliminary label assignment, which were then reviewed and corrected by human graders. This hybrid approach, combining automated pre-screening with expert verification, allowed us to scale the curation process without sacrificing annotation quality. The full pipeline is illustrated in Figure 2.
Dataset Composition
The final curated dataset spans eight major diagnostic categories, with a long tail of less common conditions grouped under an “Others” class. Table 1 summarizes the disease distribution, and Figure 3 shows the resulting label distribution.
| Condition | Occurrence |
|---|---|
| Cataract | 2,258 |
| Diabetic Retinopathy | 1,085 |
| Glaucoma | 812 |
| Macular Edema | 760 |
| Macular Degeneration | 757 |
| Retinal Vascular Occlusion | 592 |
| Optic Neuritis/Neuropathy | 580 |
| Others | 2,199 |
The “Others” category consolidates all conditions with fewer than 500 occurrences, including Posterior Uveitis, Eye Infections, Macular Pucker, Vitreous/Retinal Hemorrhage, Posterior Capsular Opacification, Retinal Detachment/Breaks, Laser Scars, Hereditary Retinal Dystrophy, Myopia, Central Serous Chorioretinopathy, Glaucoma Suspect, Hypertensive Retinopathy, Chorioretinal Atrophy, Large Cup, and Chorioretinal Neovascularization.
Because images can carry multiple simultaneous diagnoses, the dataset yields 59 unique combinations of disease labels. This combinatorial diversity is precisely what makes MuDaRI challenging and valuable: no two patients are guaranteed to present identically, and a model must learn to assign any subset of the eight classes independently rather than selecting a single winner.
Multilabel Classifier
Data Splits
Images were drawn from two sources: the CTEH collection and the Messidor dataset. Table 2 summarizes the data sources, and Table 3 shows the per-condition breakdown across train, validation, and test splits.
| Dataset | Partition | Images |
|---|---|---|
| CTEH | Train | 5,351 |
| CTEH | Test | 592 |
| Messidor | Train | 988 |
| Messidor | Test | 113 |
| Total | 7,048 |
| Condition | Train | Validation | Test |
|---|---|---|---|
| Cataract | 1,823 | 202 | 233 |
| Diabetic Retinopathy | 1,353 | 150 | 168 |
| Glaucoma | 662 | 74 | 76 |
| Macular Edema | 765 | 85 | 104 |
| Macular Degeneration | 508 | 68 | 81 |
| Retinal Vascular Occlusion | 468 | 52 | 72 |
| Optic Neuritis/Neuropathy | 470 | 52 | 58 |
| Others | 1,800 | 200 | 199 |
| Normal | 415 | 46 | 54 |
Model Architecture
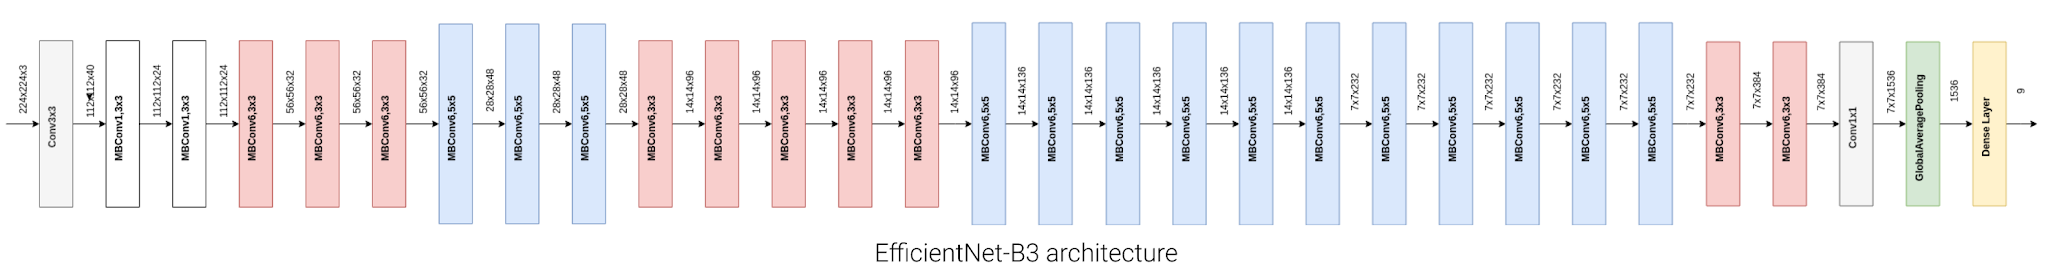
Our classifier is built on EfficientNet-B3 (Tan & Le, 2019), a highly parameter-efficient convolutional network that achieves strong ImageNet performance via compound scaling of depth, width, and resolution. We initialize the network with ImageNet pretrained weights and replace the final classification head with a 9-node fully connected layer with sigmoid activations, enabling independent probability estimates for each disease class. This formulation treats the problem as nine simultaneous binary classification tasks rather than a single mutually exclusive choice, directly accommodating images with multiple concurrent diagnoses. The adapted architecture is shown in Figure 4.
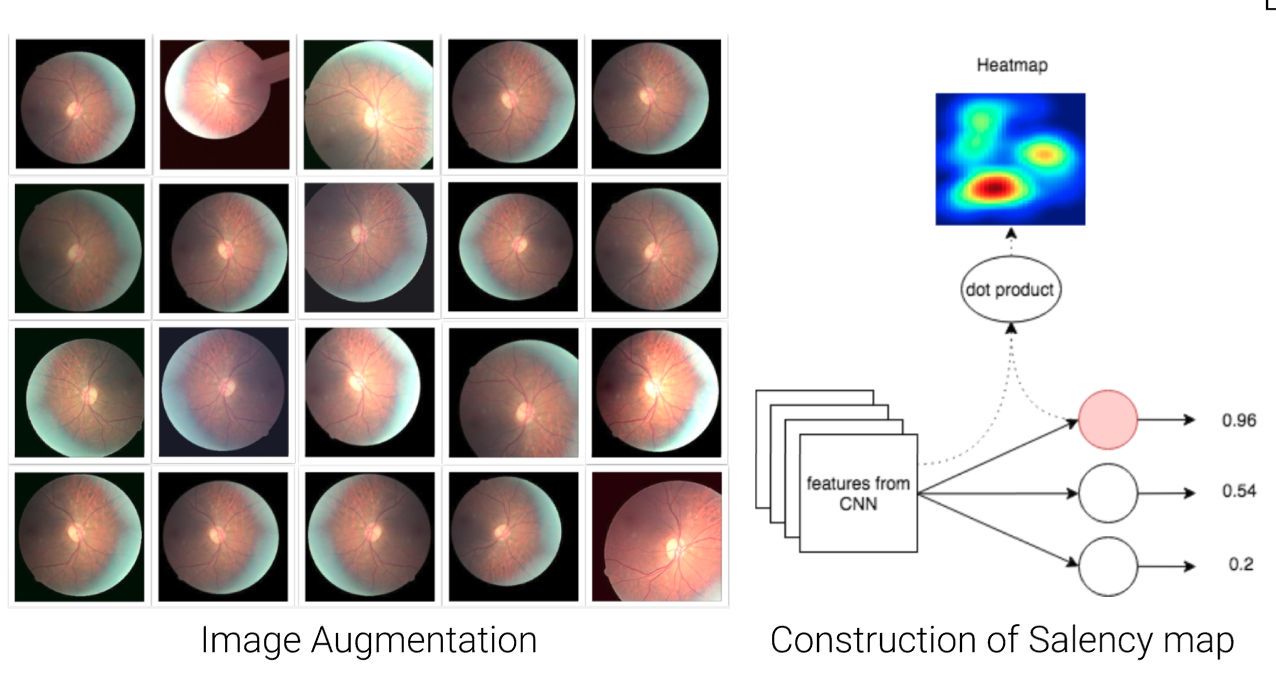
Two additional techniques were applied to improve generalization. First, real-time data augmentation (random flips, rotations, color jitter, and zoom) was applied during training to expand the effective diversity of the training set and reduce overfitting. Second, the training loss was modified to account for class imbalance, which is substantial given that conditions such as Glaucoma and Retinal Vascular Occlusion are far less frequent than Cataract. Finally, to support interpretability and facilitate clinician feedback, saliency maps (Simonyan et al., 2014) are computed for each prediction, highlighting the image regions that most strongly drive the model’s output. Examples of augmented images and their saliency maps are shown in Figure 5.
Results
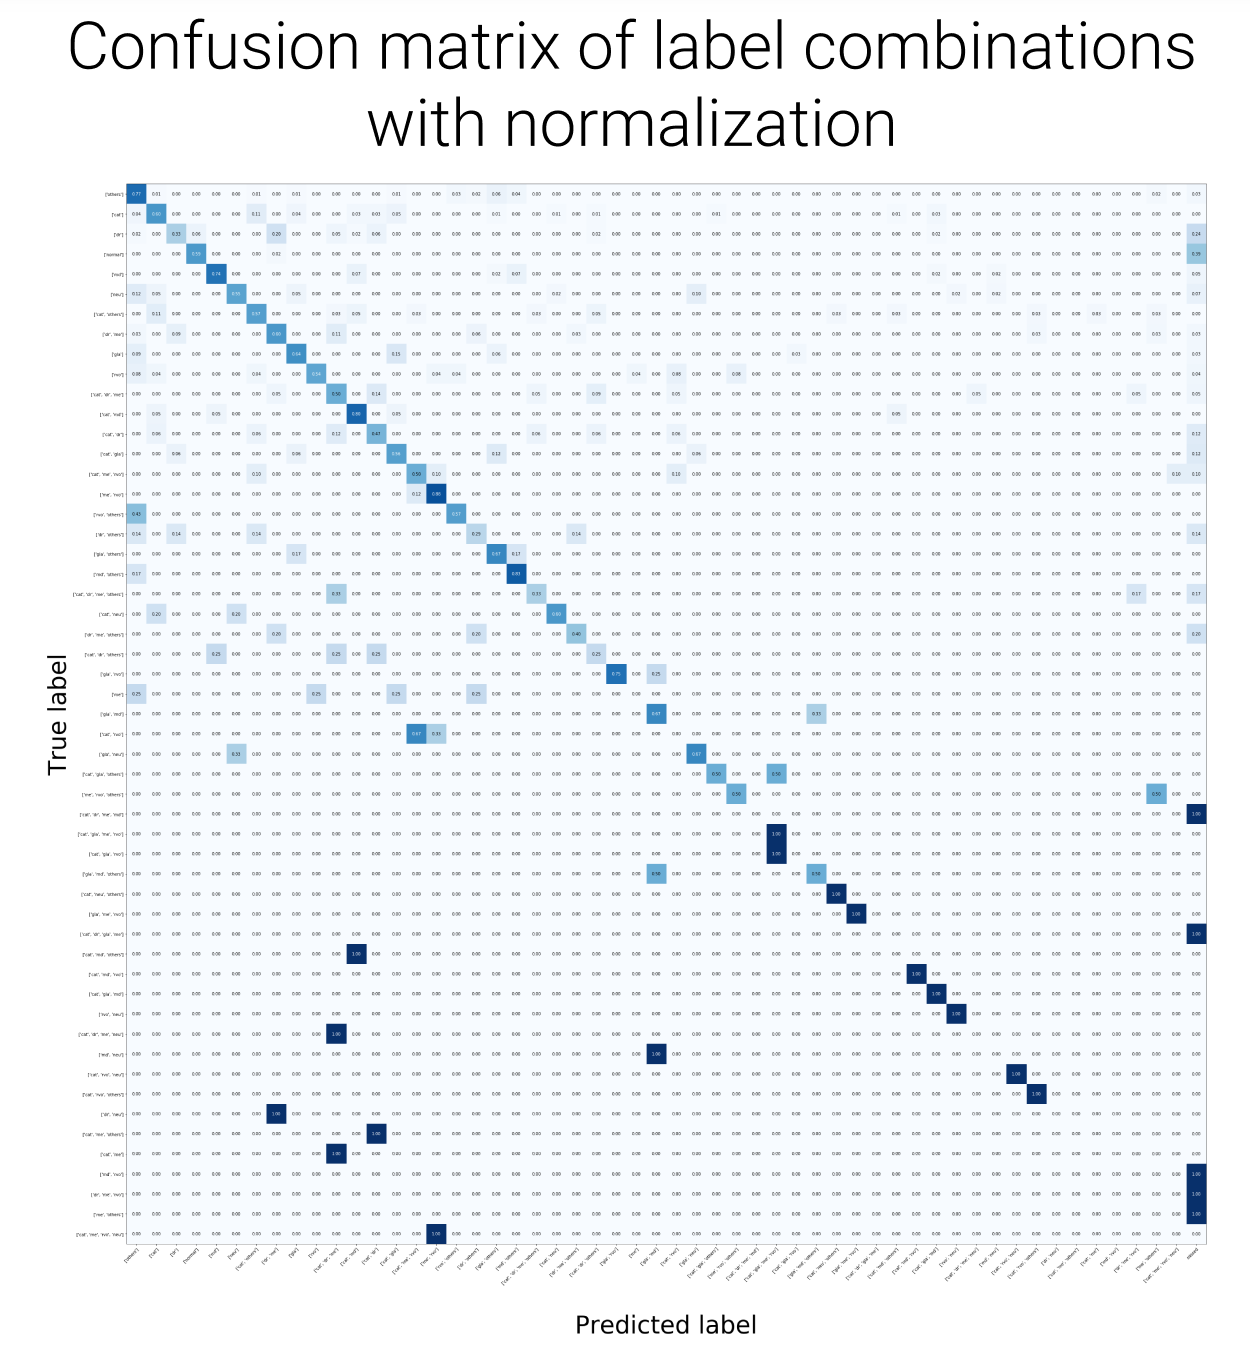
The model was evaluated using standard example-based multilabel metrics on the held-out test set, reported in Table 4. Per-class confusion matrices are shown in Figure 6.
| Metric | Score |
|---|---|
| Exact Match Ratio | 0.59 |
| Accuracy | 0.76 |
| Recall | 0.89 |
| Specificity | 0.95 |
| Precision | 0.79 |
| F1-Score | 0.82 |
The exact match ratio of 0.59 reflects cases where the model’s predicted label set perfectly matches the ground truth, a strict criterion given the combinatorial space of possible multi-disease configurations. The high recall (0.89) and specificity (0.95) indicate that the classifier is conservative in producing false negatives while also avoiding excessive false alarms, which is desirable for a screening context where missing a true positive carries greater clinical cost than a false referral.
Application Demo
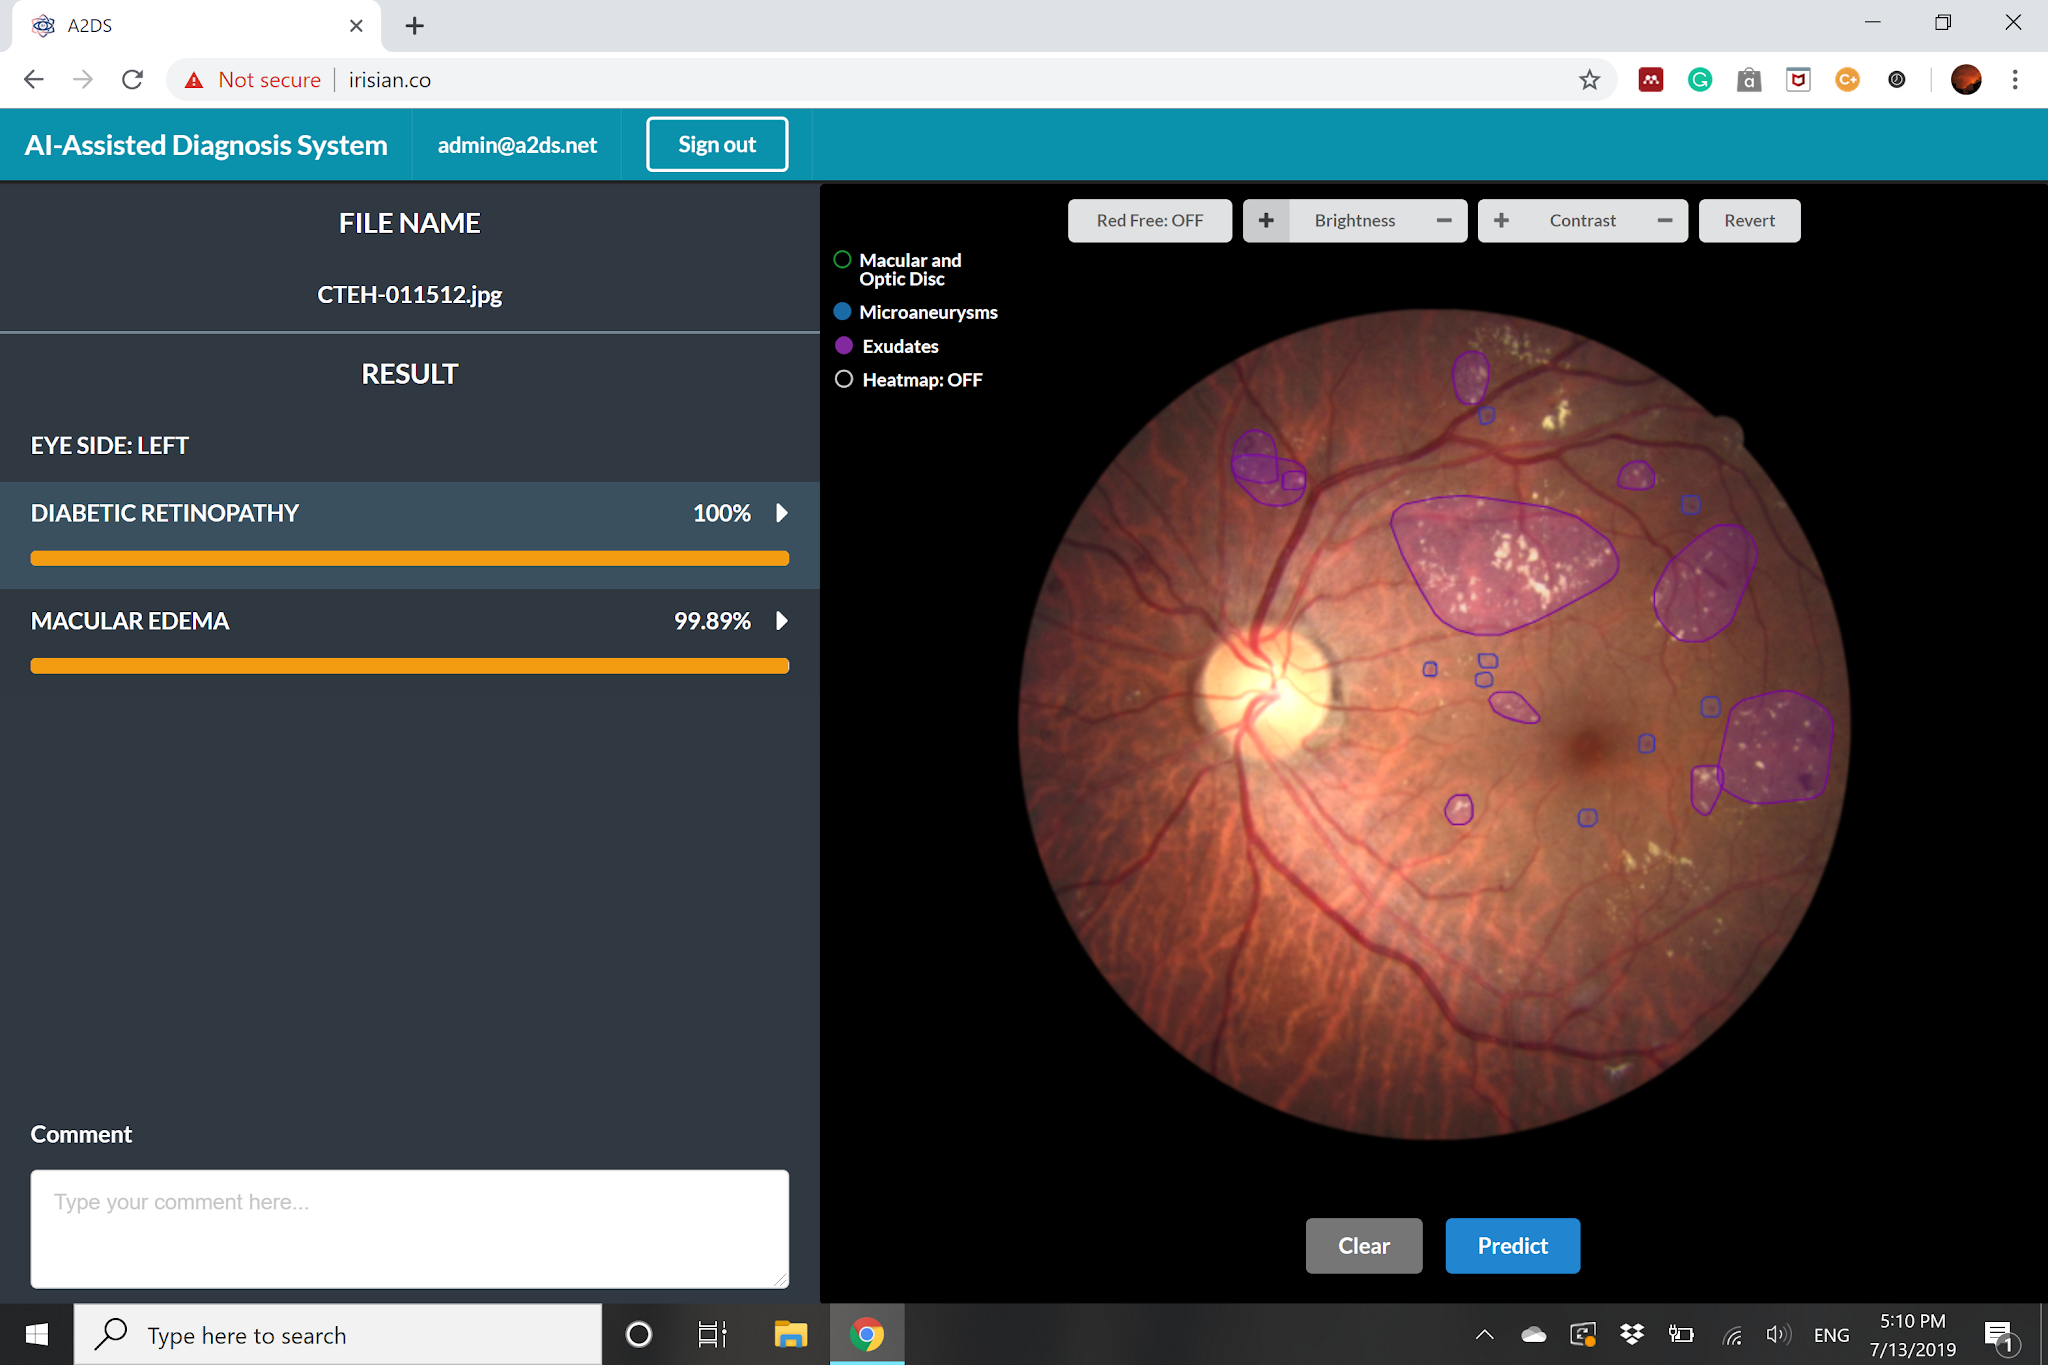
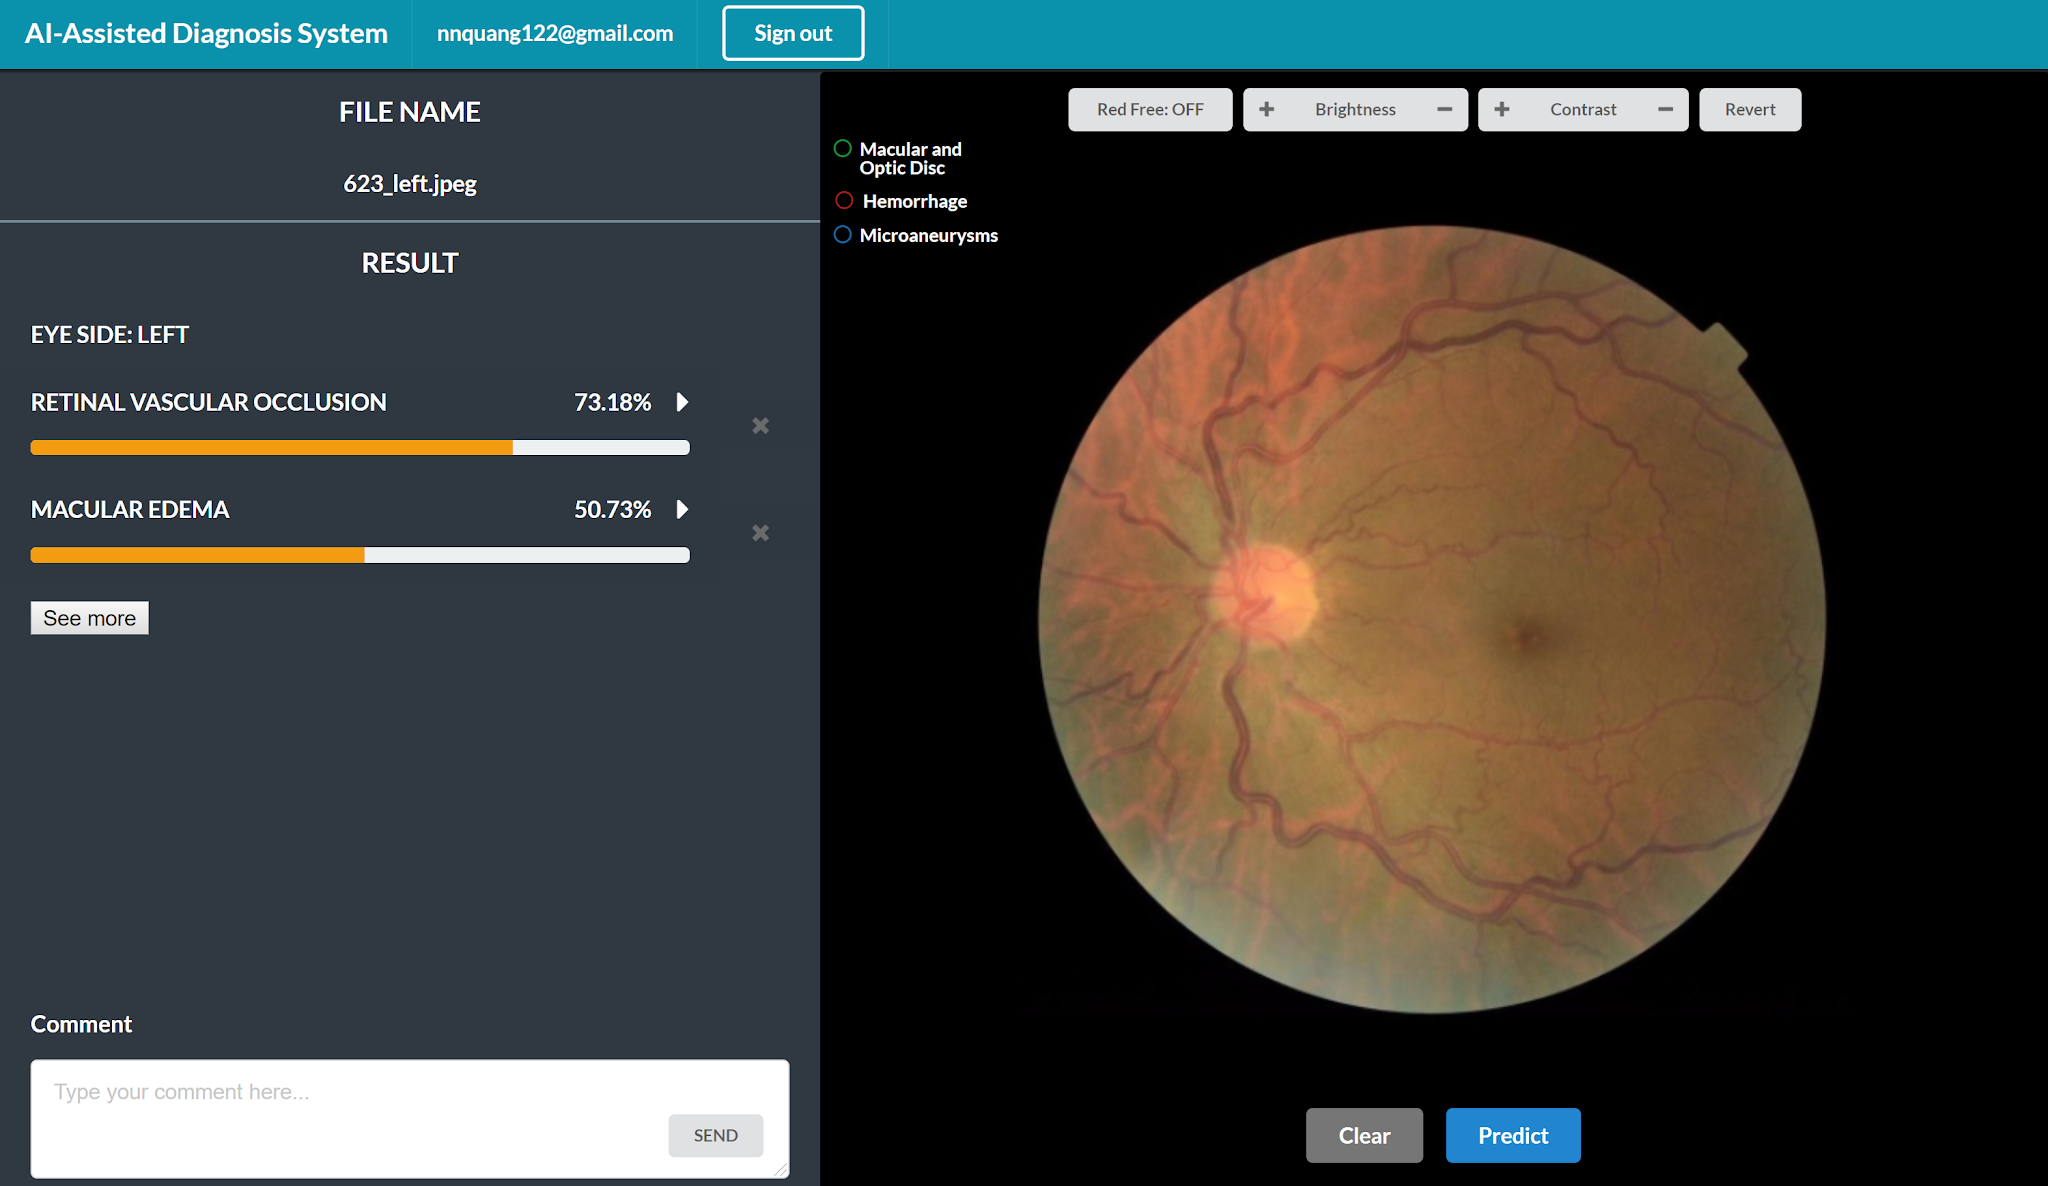
To demonstrate real-world utility, the classifier was integrated into a prototype screening interface. A clinician uploads a fundus photograph and receives a ranked list of predicted conditions alongside the corresponding saliency map, enabling rapid triage and supporting a more transparent second-opinion workflow. Screenshots of the interface are shown in Figure 7.
Conclusion
This project addresses a structural gap in retinal AI research: the absence of large-scale, multilabel annotated datasets that reflect the co-occurrence of multiple ocular diseases in real clinical populations. By curating MuDaRI and training an EfficientNet-B3-based multilabel classifier on it, we demonstrate that a single model can simultaneously screen for eight major retinal conditions from one fundus photograph, with strong recall and specificity across classes.
The high recall in particular has practical implications for deployment: screening systems must minimize missed diagnoses, and the model’s behavior aligns with this priority. The saliency map integration further supports clinical adoption by making the model’s reasoning interpretable to ophthalmologists, enabling more productive human-AI collaboration.
Future directions include expanding the dataset with additional disease categories, incorporating multi-reader annotations to quantify labeling uncertainty, and evaluating the classifier across imaging devices and patient populations to assess generalizability.
References
2019
- EfficientNet: Rethinking Model Scaling for Convolutional Neural NetworksIn Proceedings of the 36th International Conference on Machine Learning (ICML), 2019
2014
- Deep Inside Convolutional Networks: Visualising Image Classification Models and Saliency MapsIn ICLR Workshop, 2014
2009
- EyePACS: An Adaptable Telemedicine System for Diabetic Retinopathy ScreeningJournal of Diabetes Science and Technology, 2009