Fractals EEG Motor Imagery
Investigating fractal dimension as a non-linear correlate of event-related desynchronization in motor imagery EEG
Published at the 37th Annual International Conference of the IEEE Engineering in Medicine and Biology Society (EMBC 2015) (Nguyen et al., 2015).
This project was carried out during a short-term cultural exchange program with the Tokyo University of Agriculture and Technology (TUAT), where I was a visiting student in the Biologically-inspired Computing Laboratory of Professor Toshiyuki Kondo.
Introduction
Conventional EEG analysis of motor imagery relies on spectral features: specifically, event-related desynchronization (ERD) and event-related synchronization (ERS), which track changes in band-limited power during imagined movement. These are well-established, linear measures that capture the oscillatory dynamics of the sensorimotor cortex. For the background on ERD/ERS and the motor imagery BCI paradigm, see the companion primer [Primer] Brain-Computer Interfaces Using EEG.
A parallel line of inquiry treats the EEG signal as a non-linear, complex system and asks what its geometric and dynamical properties reveal about brain state. Fractal dimension is one such measure: it quantifies the complexity and irregularity of a time series in a way that is orthogonal to spectral power. For the technical background on fractal dimension and Higuchi’s algorithm used here, see the companion primer [Primer] Fractal Dimension in EEG Signal Analysis.
This study asks a focused question: do the non-linear complexity characteristics of EEG signals, quantified by fractal dimension, covary with ERD during motor imagery? If so, how tightly do they track each other in time, and does this relationship generalize across subjects and datasets?

Methods
Dataset
The dataset was provided by the Department of Medical Informatics, Institute for Biomedical Engineering, University of Technology Graz, Austria, as part of the BCI Competition III (Blankertz et al., 2004). Three datasets were used:
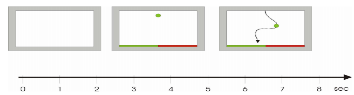
- O3VR: collected from a virtual reality experiment
- S4b and X11b: collected using an adaptive basket paradigm
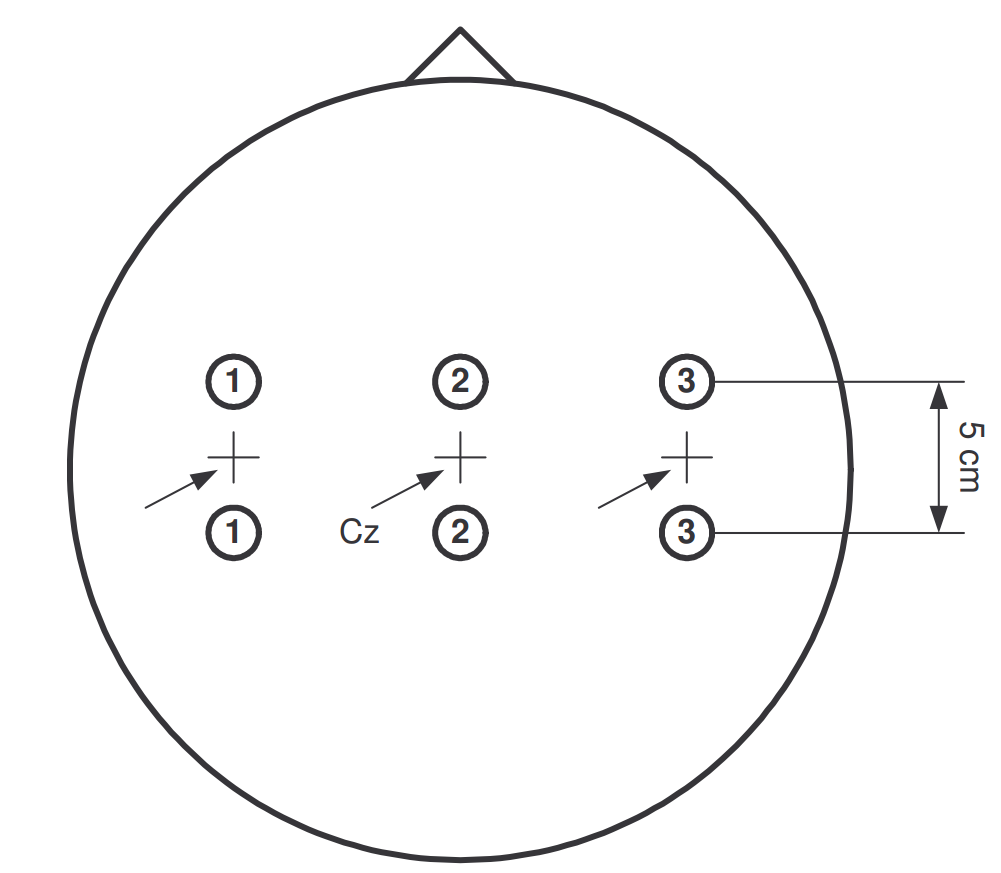
Each dataset consisted of two bipolar EEG channels: C3 and C4, placed over the left and right sensorimotor cortices respectively.
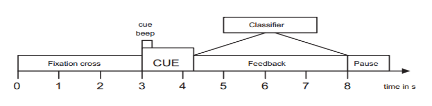
The experiment consisted of 3 sessions per subject, each with 9 runs of 40 feedback trials, for a total of 1080 trials per subject. Within each trial, a fixation cross was shown from 0 to 2 seconds, a motor imagery cue appeared at 2 seconds, feedback ran from approximately 4 to 7.5 seconds, and a pause period followed.
ERD/ERS Quantification
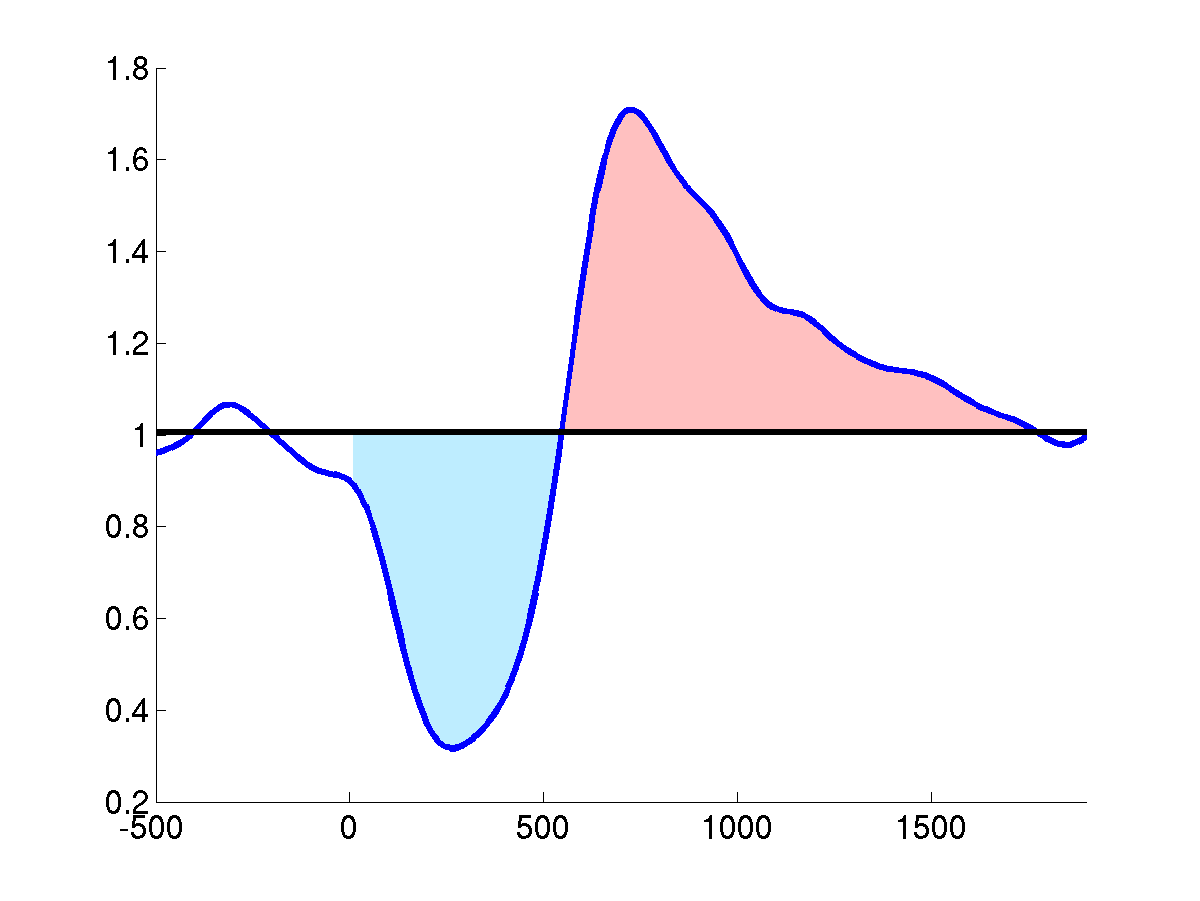
ERD and ERS were quantified using the standard Pfurtscheller and Aranibar method (Pfurtscheller & Aranibar, 1979), expressed as a percentage power change relative to a pre-cue baseline interval. Positive values indicate ERS (power increase); negative values indicate ERD (power decrease):
\[\text{ERD/ERS}_j = \frac{P_j - R}{R} \times 100\%\]where \(P_j\) is the inter-trial average power at sample \(j\), and \(R\) is the mean baseline power over the pre-event reference interval. The method requires a reference period: the signal is first narrow-bandpass filtered (e.g., 5-10 Hz for the lower mu band), squared sample-by-sample to obtain instantaneous power, and averaged across trials before applying the formula. Two bands were analyzed: 5-10 Hz (lower mu band) and 20-25 Hz (beta band).
Fractal Dimension Estimation
Fractal dimension was estimated using Higuchi’s algorithm (Higuchi, 1988). For a time series \(X(1), \ldots, X(N)\), define a family of sub-series at interval \(k\) with initial offset \(m\):
\[X_k^m = \left\{ X(m + ik) \right\}_{i=0}^{\lfloor(N-m)/k\rfloor}\]The normalized length of each sub-series is:
\[L_m(k) = \frac{1}{k} \left[ \left( \sum_{i=1}^{\lfloor(N-m)/k\rfloor} \left| X(m+ik) - X(m+(i-1)k) \right| \right) \cdot \frac{N-1}{\lfloor(N-m)/k\rfloor \cdot k} \right]\]Averaging \(L_m(k)\) over all offsets \(m = 1, \ldots, k\) yields \(\langle L(k) \rangle\). For a fractal signal, this scales as a power law in \(k\):
\[\langle L(k) \rangle \propto k^{-D}\]The fractal dimension \(D\) is the negative slope of the log-log regression of \(\langle L(k) \rangle\) against \(k\). Unlike ERD/ERS, the algorithm operates directly on the time-domain signal and requires no baseline period, making it an absolute measure of signal complexity in any given window. A sliding window was applied to produce a FD time course directly comparable to the ERD/ERS spectral-temporal map.
Comparing the Two Methods
Both ERD/ERS and Higuchi’s FD are feature extraction methods targeting the same neural event, but they approach it from fundamentally different angles:
| Property | ERD/ERS | Higuchi's FD |
|---|---|---|
| What it measures | Relative change in band-limited power | Complexity / irregularity of the time-domain signal |
| Signal model | Linear (spectral power) | Non-linear (scaling law) |
| Frequency specificity | Band-specific: requires bandpass filtering first | Broadband aggregate; no frequency transform needed |
| Baseline dependence | Mandatory: relative to a reference period $$R$$ | None: $$D$$ is absolute within any window |
| Sensitivity | Oscillatory synchronization in a defined band | Signal structure across all timescales |
| Real-time suitability | Moderate: FFT or filtering pipeline required | High: operates on raw samples, no spectral transform |
A practical consequence of these differences is that ERD/ERS is well-suited to verifying that a subject is correctly performing the motor imagery task, since power suppression in the mu and beta bands is the canonical marker of sensorimotor cortical engagement. Higuchi’s FD, on the other hand, does not require a known baseline, generalizes across frequency bands, and tends to capture hidden dynamical structure that linear power metrics can miss. This makes it attractive as an input feature for BCI classifiers, where non-linear complexity measures can complement spectral features and improve robustness.
One further advantage of HFD that is particularly relevant for real-time BCI applications is computational cost. HFD operates entirely in the time domain: the algorithm computes absolute differences between samples and sums them, followed by a single linear regression on a log-log plot. These are elementary arithmetic operations, and the overall complexity scales as \(O(N)\) in the number of samples \(N\) per window.
ERD/ERS quantification requires first isolating a frequency band, either by computing a Fast Fourier Transform (\(O(N \log N)\)) or by applying a digital bandpass filter (FIR or IIR). Filtering involves repeated convolutions, which are substantially heavier than the additions and subtractions in HFD. This difference compounds in a real-time BCI loop where features must be recomputed every few hundred milliseconds across multiple channels simultaneously.
In short, HFD extracts a meaningful neural feature with less compute and no spectral transform, which is why it is a natural candidate for low-latency, embedded, or resource-constrained BCI systems.
Results
The main result is shown below: for all six channels across the three datasets, the global minimum in FD over time corresponds to the peak ERD event in the spectral-temporal map.
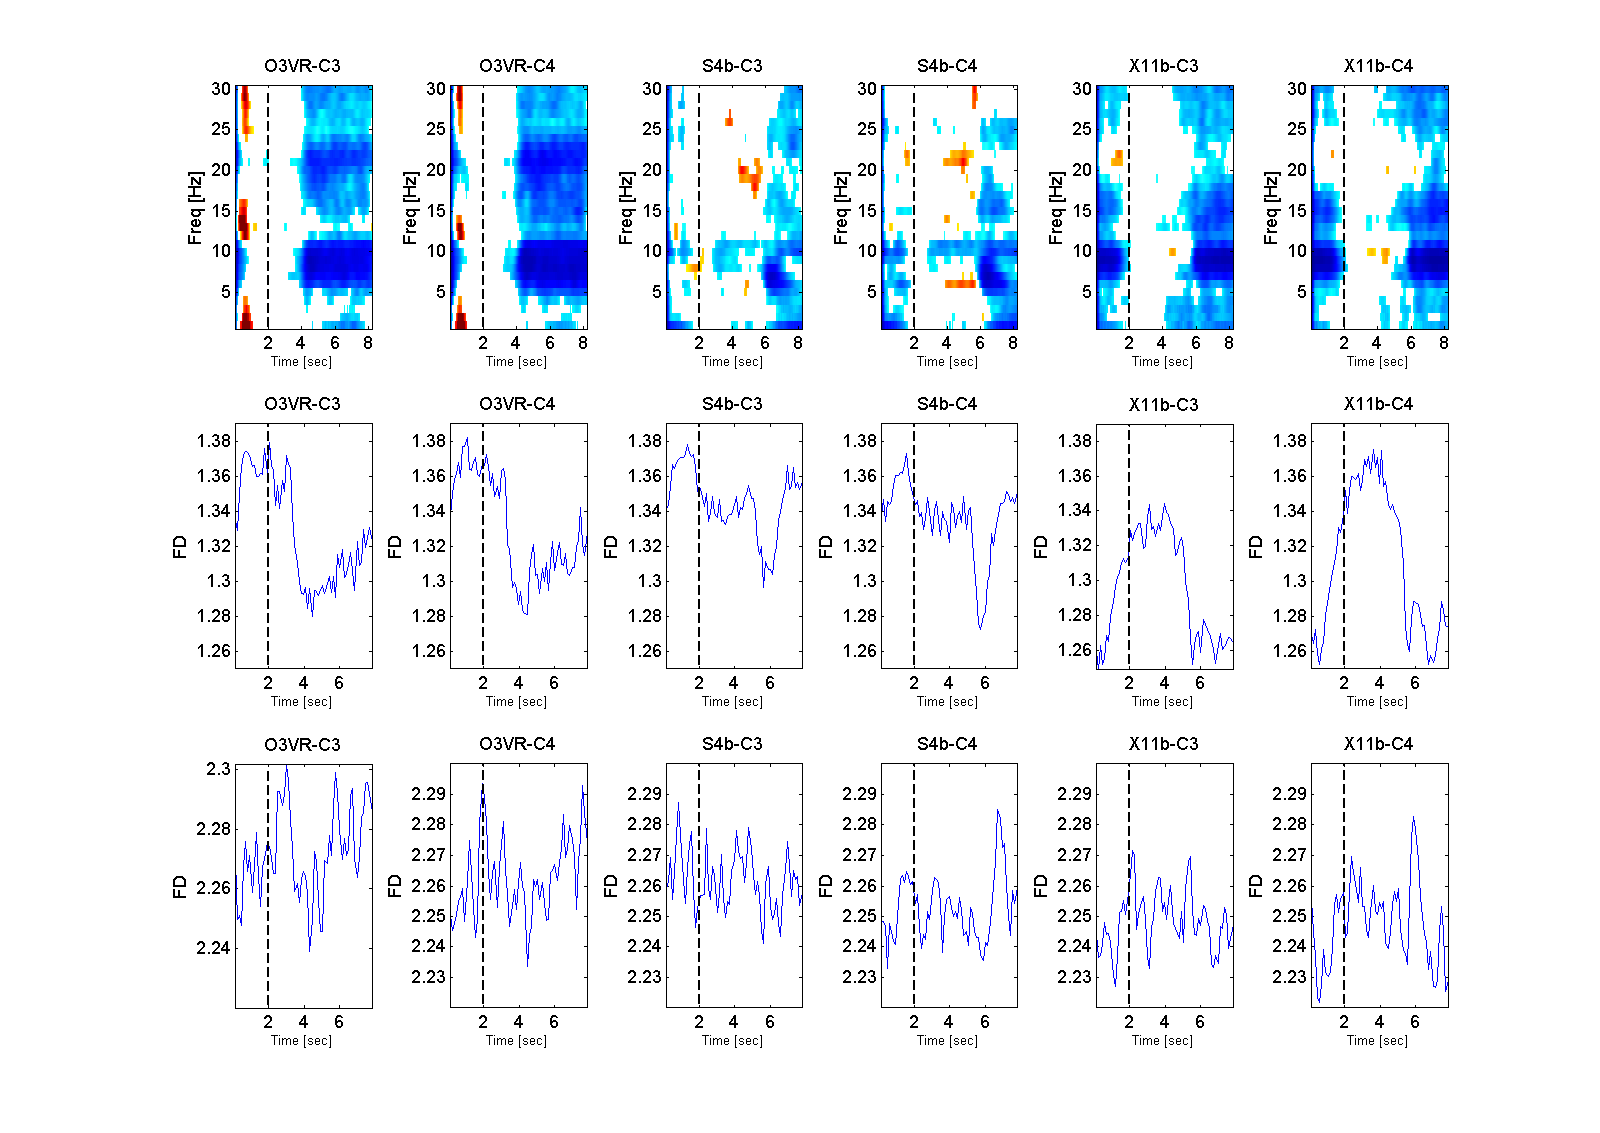
The correspondence between the ERD peak (maximum power suppression) and the FD minimum (lowest complexity) held consistently across datasets:
| Subject | Channel | Hand Imagery | ERD latency (s) | FD latency (s) |
|---|---|---|---|---|
| O3VR | C3 | Left | 4.92 | 4.21 |
| Right | 4.63 | 3.85 | ||
| C4 | Left | 4.59 | 3.97 | |
| Right | 5.50 | 4.33 | ||
| S4b | C3 | Left | 6.26 | 5.65 |
| Right | 6.87 | 5.65 | ||
| C4 | Left | 6.21 | 5.65 | |
| Right | 6.28 | 5.89 | ||
| X11b | C3 | Left | 6.64 | 6.85 |
| Right | 7.43 | 7.81 | ||
| C4 | Left | 7.63 | 6.73 | |
| Right | 6.78 | 5.65 | ||
| Mean | 6.145 | 5.52 | ||
| SD | 1.03 | 1.24 | ||
The alignment is consistent with the interpretation that both measures track the same underlying neural event: the onset and peak of motor cortical engagement during motor imagery. The FD minimum corresponds to a moment of reduced signal complexity, coinciding with the maximal suppression of the mu rhythm.
Conclusion
This study establishes a consistent relationship between ERD patterns and the fractal complexity of EEG during motor imagery:
- The global minimum in fractal dimension aligns with the ERD peak across all datasets and channels examined. This suggests that the two measures are tracking the same underlying neural transition.
- When the brain enters an active motor imagery state, EEG signals become less random and more structured in a particular way, reflected as decreased fractal dimension. This is consistent with the interpretation that motor cortical activity during imagery is not random but organized around specific neural dynamics.
- Low FD values during motor imagery may serve as a strong indicator for the occurrence of motor imagery, offering a non-linear complement to spectral ERD features for BCI classification.
A limitation of this work is that the relationship between fractal dimension and ERS, the post-movement power rebound, was not fully characterized. The FD time course during the ERS period showed less consistent behavior, and the mechanisms governing FD during cortical synchronization remain an open question.
These findings motivate further use of non-linear complexity measures alongside conventional spectral features in motor imagery BCI systems, where they may provide complementary information that improves classification robustness.